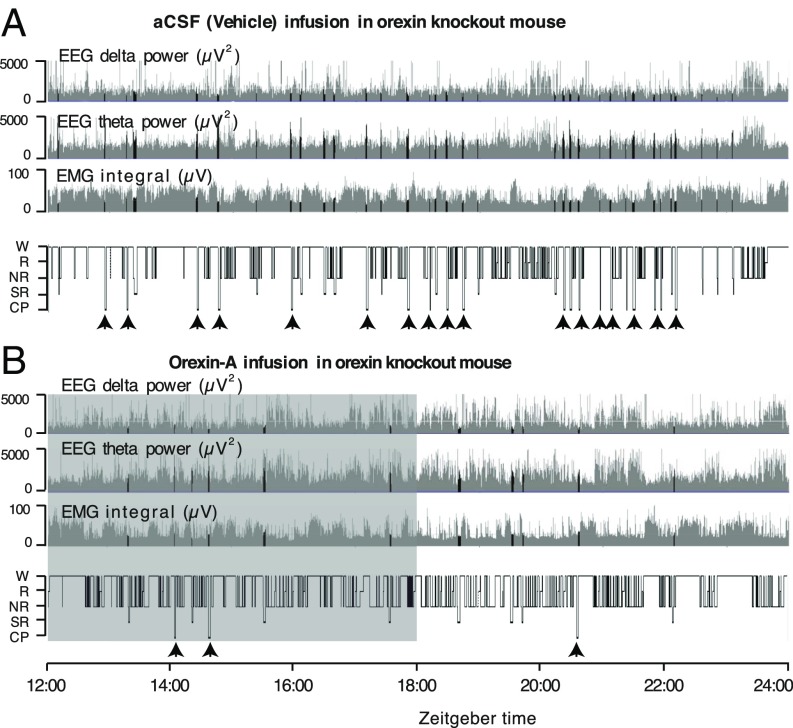
Fig. 2.
Intrathecally delivered orexin-A suppressed cataplexy and SOREM in orexin knockout mice. (A and B) Typical examples of EEG delta power (0.5–4 Hz), EEG theta power (4–10 Hz), EMG integral, and hypnograms of an orexin knockout mouse during aCSF (vehicle) (A) and orexin-A (B) infusion with chocolate provided in the cage. Hypnograms represent concatenated 10-s epochs of EEG/EMG activity, scored as wake, REM, NREM (gray), and SOREM and cataplexy (black). Twelve hours per mouse, starting at the beginning of the dark phase, are shown. The shaded area in B shows the duration of orexin-A infusion. CP, cataplexy; NR, NREM sleep; R, REM sleep; SR, SOREM; W, wake.

