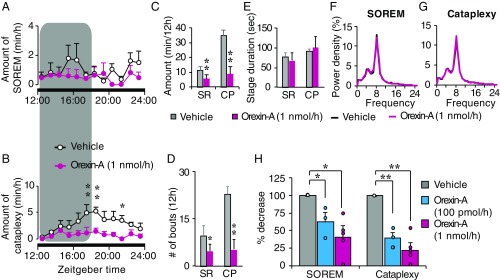
Fig. 3.
Intrathecal orexin-A infusion suppressed cataplexy and SOREM in orexin knockout mice. (A and B) Hourly plots of SOREM and cataplexy during vehicle and orexin-A infusion within the 12-h dark phase. The shaded area on graphs represents the duration of orexin-A infusion. (C) Total amounts of time spent in SOREM and cataplexy within the 12-h dark phase, during vehicle and orexin-A infusion. (D and E) The number of bouts (D) and stage duration (E) of SOREM and cataplexy during a vehicle and orexin-A infusion. (F and G) EEG power densities of SOREM (F) and cataplexy (G) episodes during vehicle and orexin-A infusion. Values are presented as mean ± SEM; n = 4; *P ≤ 0.05, **P ≤ 0.01 by using two-way ANOVA (A, B, F, and G) and paired t test (C–E). (H) Dose-dependent changes in SOREM and cataplexy in orexin knockout mice during/after vehicle, orexin-A (100 pmol/1 µL/h and 1 nmol/1 µL/h, blue bars and red bars, respectively). Circles represent individual animal values. Values are mean ± SEM; n = 3–5; *P ≤ 0.05, **P ≤ 0.01 by using one-way ANOVA, followed by Scheffé’s post hoc test. CP, cataplexy; orexin-A, colored lines and bars; SR, SOREM; vehicle, black lines and gray bars.

