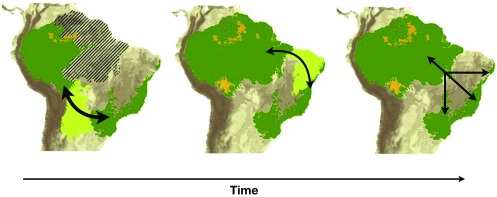
Fig. 1.
Current and potential past distributions of South American tropical forest based on speleothem data (12). Dark green shows extant tropical forests, and light green shows possible forest corridors at different times. Arrows on the maps indicate possible dispersal routes between the Atlantic Forest and the Amazon, while the x-axis indicates the time sequence suggested by various authors (e.g., refs. 19 and 20). Southern forest corridors are thought to have been more stable and to have lasted longer (∼50 kya), while the more recent northern corridor is thought to have been less stable and to have lasted for a shorter time (5–10 kya) (12). Adapted with permission from ref. 12, Springer Nature: Nature Communications, copyright (2013).

