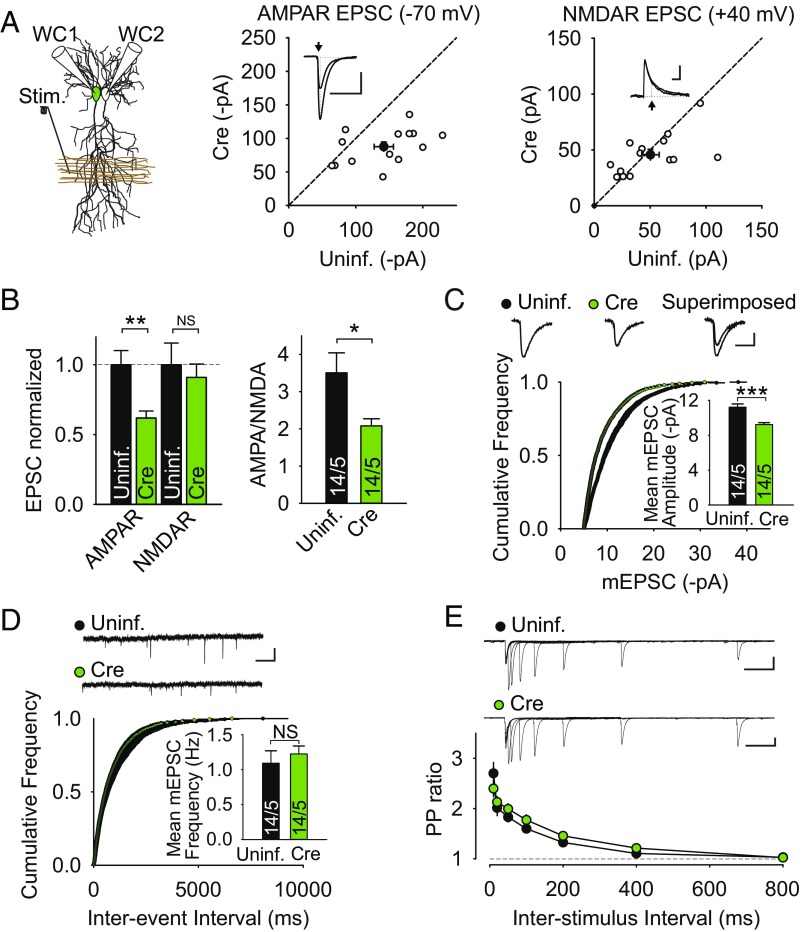
Fig. 3.
LRRTM1,2 deletion reduces AMPAR-mediated synaptic transmission. (A, Left) Schematic of simultaneous dual whole-cell (WC) recording from neighboring CA1 pyramidal cells during stimulation (Stim.) of inputs in stratum radiatum. (A, Center and Right) Graphs show scatter plots of amplitudes of simultaneously recorded AMPAR and NMDAR EPSCs (n = 14 pairs from 5 LRRTM1,2 cKO mice). Filled circles are means ± SEMs. Arrow next to representative EPSC pairs indicate time at which AMPAR and NMDAR EPSC amplitudes were measured. (Scale bars: 50 pA, 50 ms.) (B) Summary graphs of normalized AMPAR and NMDAR EPSCs (Left) and AMPAR/NMDAR ratios (Right) from cells in A. (C) Cumulative probability plot of mEPSC amplitudes and summary bar graphs of mean mEPSC amplitude from uninfected and Cre-expressing cells. Sample mEPSC traces are shown above graphs. (Scale bars: 5 pA, 5 ms.) n in bar graphs represents cells/mice. (D) Cumulative probability plot of mEPSC interevent interval and summary bar graphs of mean mEPSC frequency from uninfected and Cre-expressing cells. Sample mEPSC traces are shown above graphs. (Scale bars: 10 pA, 1 s.) “n” in bar graphs represents cells/mice. (E) Summary graph of the paired-pulse (PP) ratios at different interstimulus intervals (ISIs) for uninfected and Cre-expressing cells. Data are means ± SEM (n = 17/10 uninfected cells/mice and n = 17/8 infected cells/mice at all ISIs except for 10 and 800 ms, where n = 7/3 uninfected cells/mice and n = 10/3 infected cells/mice). Sample traces are shown above graphs. (Scale bars: 50 pA, 100 ms.) All values plotted with error bars are mean ± SEM. *P < 0.05; **P < 0.01; ***P < 0.001; NS, not significant. Uninf., uninfected.

