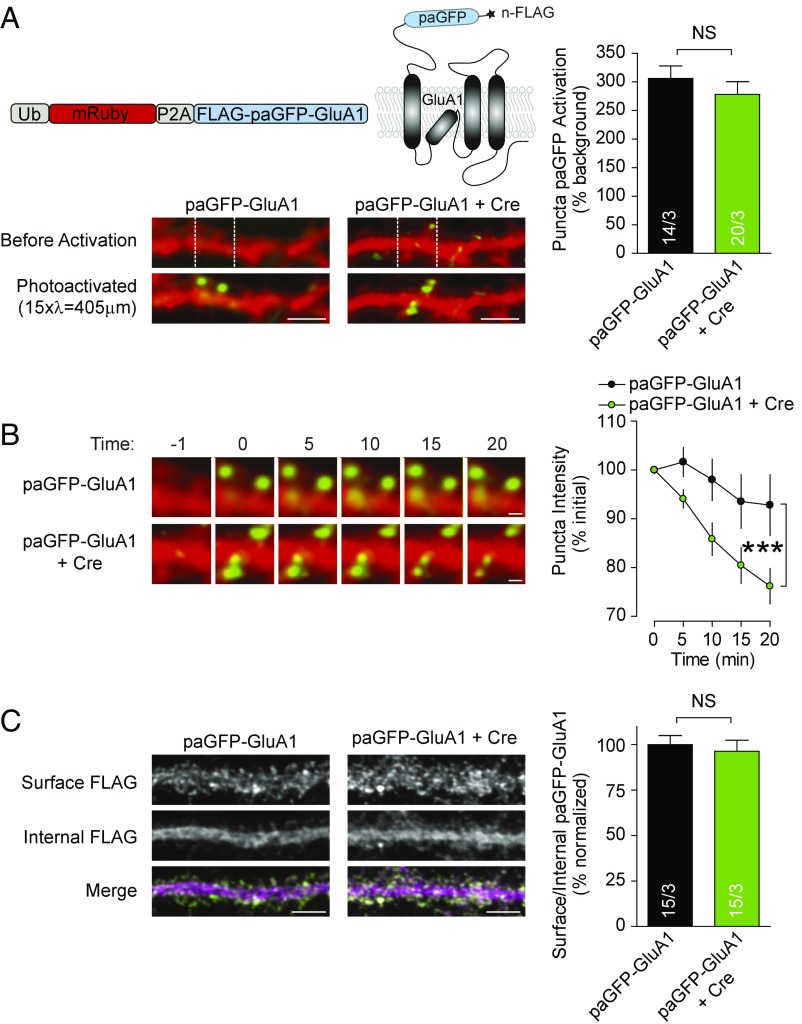
Fig. 4.
Diffusion of photoactivatable GFP-tagged GluA1 out of spines is greater in spines lacking LRRTM1,2. (A, Upper Left) Schematic of construct that expresses soluble mRuby and paGFP tagged GluA1. (A, Lower Left) Representative images show secondary dendrites in disassociated hippocampal culture prepared from LRRTM1,2 floxed mice before and after photoactivation of paGFP-GluA1 in the demarcated region. Cells expressed paGFP-GluA1 alone or with Cre recombinase. (A, Right) Bar graphs show quantification of the photoactivation in spines. (Scale bars: 5 µm.) (B, Left) Representative images show montages of photoactivated dendritic regions during the course of an experiment. (B, Right) Quantification of puncta intensity over time in photoactivated regions. In Left Upper, note that the paGFP-GluA1 puncta do not change, while in Left Lower, the puncta decrease. (Scale bars: 1 µm.) (C, Left) Representative images of primary dendrites showing surface (nonpermeabilized) or internal (postpermeabilization) FLAG epitope staining in cells expressing paGFP-GluA1. (C, Right) Quantification of the ratio of surface to internal staining. (Scale bars: 5 µm.) Experimental n values are shown in bars and give cells/cultures. All values plotted with error bars are mean ± SEM. ***P < 0.001; NS, not significant.

