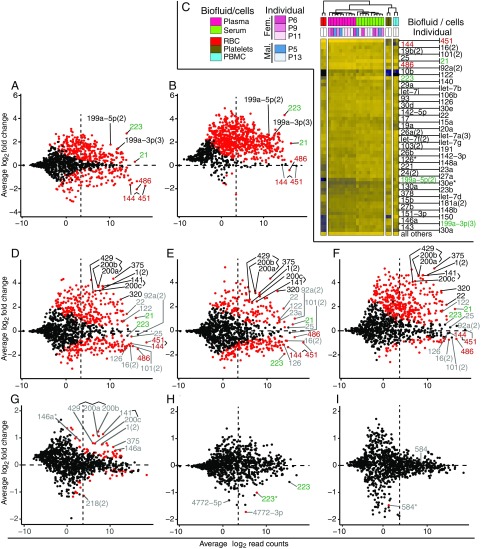
Fig. 3.
Differences in miRNA abundance based on type of biofluid, individual P12, gender, female hormonal cycle, and prandial state. MA plots are based on merged miRNA read counts from Dataset S3 and tabulated values describing lfc values, and their significance can be found in Dataset S4. Significant differences in abundance are indicated by red dots for Padj < 0.05. Blood-based miRNAs are labeled in red (RBCs) and green (platelets/PBMCs). Select examples of additional miRNAs discussed in the text are labeled black when their abundance variance is greater than fourfold (lfcs ≤ −2 or ≥2), while smaller magnitudes are shown in gray. A count of 10 normalized reads, which has been chosen as a lower threshold for data analyses to eliminate noise, is indicated by a dashed vertical line. Count normalization in this analysis considers all miRNA sample reads, unless stated otherwise. (A and B) Serum vs. plasma, excluding individual P12, considering all miRNA reads (A) or utilizing miR-451 and 144 as standards (B) for SFE/miRNA read count normalization. (C) Unsupervised clustering separating miRNA signatures of biofluid representatives and those of RBC, PBMC, and platelets; only a few abundant miRNAs show enrichment in some of these major cellular or cell-derived blood constituents (red, green: higher relative abundance in RBC and platelets/PBMCs, respectively). (D–F) Study subject P12 vs. other male study participants, plasma (D and F) and serum (E). In F, we used Set1 calibrator reads for SFE/read count normalization. (G) Effect of gender, comparing female vs. male (plasma). For the corresponding serum comparison, see Fig. S4A. (H) Effect of menstrual cycle, comparing follicular vs. luteal state, in plasma. For the corresponding serum comparisons, see Fig. S4E. (I) Effect of fasting: preprandial vs. 4-h postprandial state, in plasma. For the 1-h preprandial vs. postprandial state comparison, see Fig. S4F.

