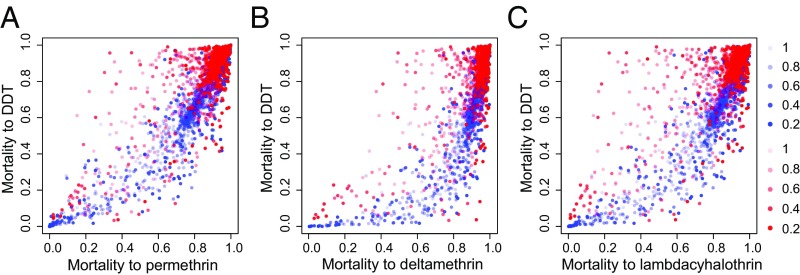
Fig. 3.
Relationships between predicted mean proportional bioassay mortalities for DDT and the three pyrethroid types. (A) DDT vs. permethrin; (B) DDT vs. deltamethrin; (C) DDT vs. λ-cyhalothrin. Points show the predicted mean at each location and time for the West region (blue) and the East region (red). Color intensity indicates the width of the posterior CI of the predicted mean.

