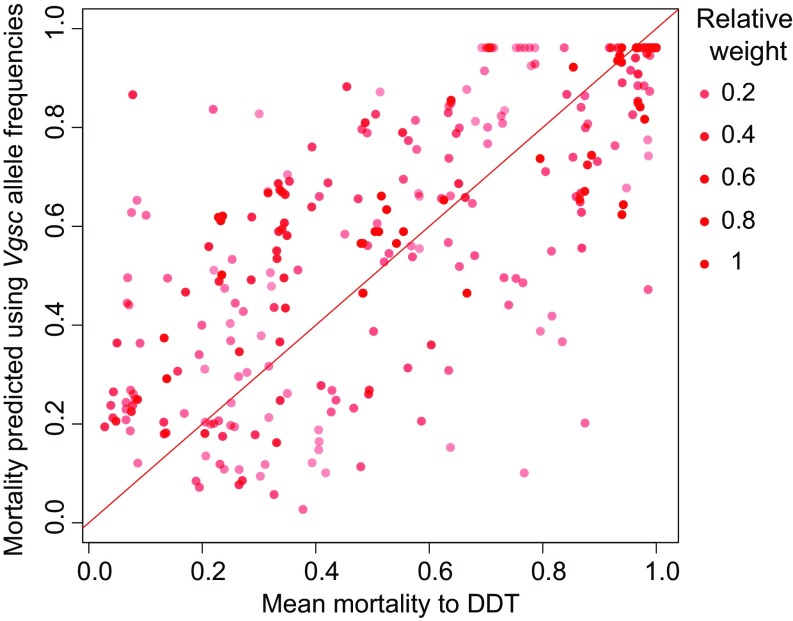
Fig. 4.
The mortality to DDT predicted by a fitted linear relationship with observed Vgsc allele prevalences (n = 316). Estimates of mean mortality following exposure to DDT obtained from our Bayesian geostatistical models (Fig. 3) were used as the response variable. Color intensity indicates the relative posterior precision of the mean mortality estimates. The diagonal line indicates equivalence between the data and the fitted values.

