Fig. 2.
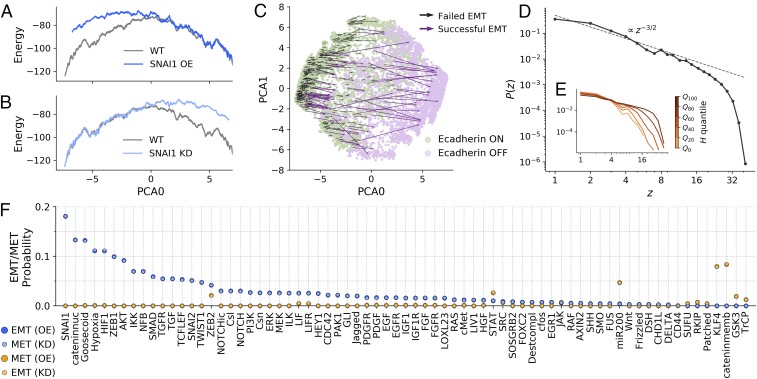
EMT/MET occurs with different probabilities through multiple paths. The model shows many forms of EMT/MET, and these occur with different probabilities. (A and B) One-dimensional PCA projection of the landscape where (A) OE or (B) KD of SNAI1 tilts the landscape toward the M or E regions, respectively. (C) Transition map under SNAI1 OE. The model displays different forms of SNAI1-induced EMT. (D) The distribution of gene expression avalanches after individual KD/OE is a power law with exponent . (E) The cutoff of the distribution depends on , quantified here by quartiles, with high- states producing larger avalanches. (F) EMT/MET probabilities under KD/OE conditions. The model lays out a nondeterministic picture of EMT/MET, where well-known factors such as SNAI1 (EMT) or KLF4 (MET) induce phenotypic transitions with higher probability (see Materials and Methods and SI Appendix, Fig. S2 for further details).

