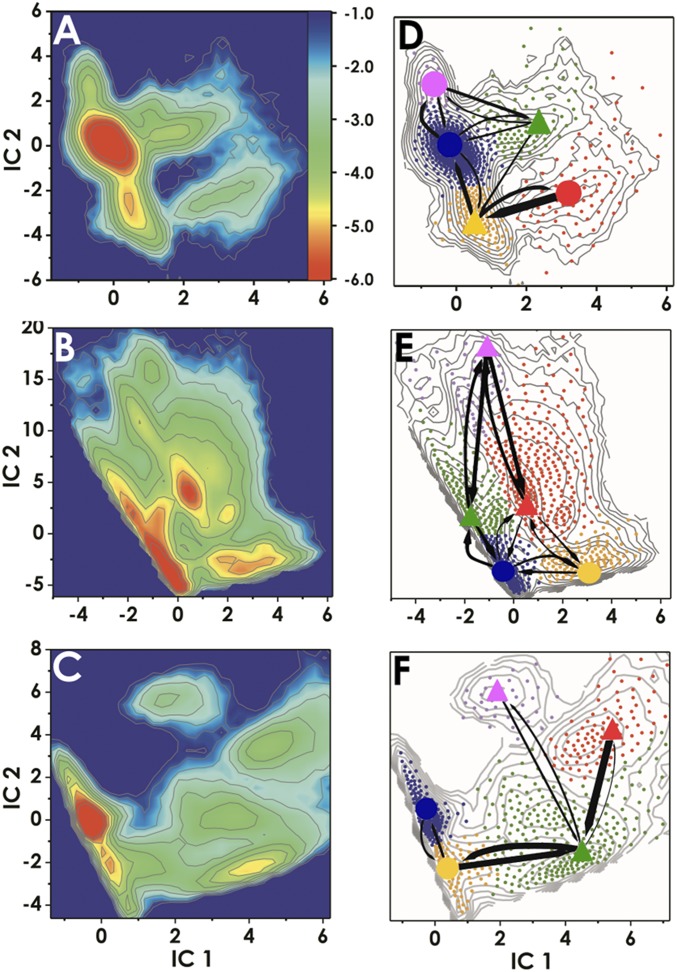
Fig. 2.
Conformational dynamics of TDG/DNA complexes during base interrogation. Computed free energy profiles projected onto the first two ICs for (A) 5caC-DNA (B) G:T mismatch, and (C) A:T base pairs. The color bar Inset denotes the ΔG scale in kcal/mol. Results from MSM analysis for (D) 5caC-DNA, (E) G:T mismatch, and (F) A:T base pair systems. D–F show the positions of all microstate clusters in the space of the two ICs (small dots); how these small clusters were agglomerated into macrostates (denoted by large dots for the intrahelical or triangles for the extrahelical states) and the probabilities of transitions between macrostates. Microstates (dots) are colored by the macrostate they belong to. To allow easy comparison of the three simulation systems, corresponding states are denoted with the same color. The relative thickness of the arrows connecting the macrostates denotes the macrostate transition probabilities computed using transition path theory.

