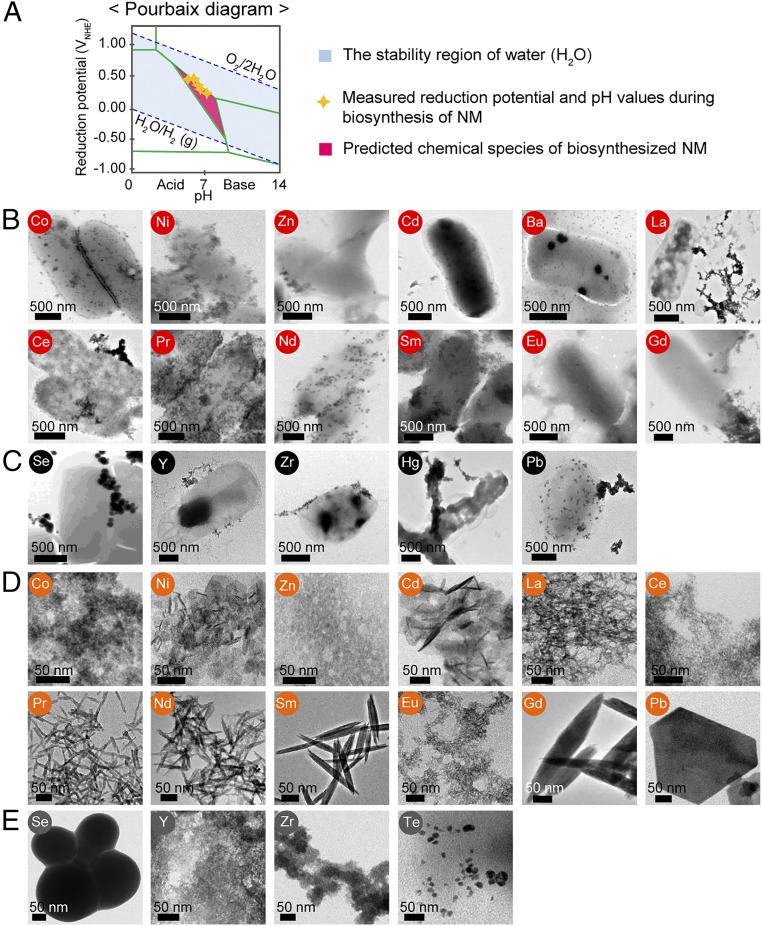
Fig. 2.
A schematic of Pourbaix diagram and various NMs biosynthesized in vivo and in vitro at the initial pH of 7.5. (A) A schematic of Pourbaix diagram indicates stable chemical species (e.g., types of element) at a given Eh and pH in an aqueous solution. The upper blue dashed line denotes the reduction potential of the oxygen evolution reaction, while the lower blue dashed line corresponds to the reduction potential of the hydrogen evolution reaction. The light-blue area represents the Eh and pH range available in stable water (38). Green boundaries illustrate the points where two different chemical species coexist forming an equilibrium. Yellow stars represent Eh and pH values experimentally measured during the 12-h period of NM biosynthesis. The pink region is where the predicted chemical species exist for the biosynthesis of NMs comprising them. Based on the Pourbaix diagram analysis, the producibility and crystallinity of NMs were examined in aqueous solution. (B) TEM images of 12 crystalline NMs synthesized in vivo at pH 7.5 with their corresponding elements labeled in red circle. (C) TEM images of five amorphous NMs synthesized in vivo at pH 7.5 with their corresponding elements labeled in black circle. (D) TEM images of 12 crystalline NMs synthesized in vitro at pH 7.5 with their corresponding elements labeled in orange circle. (E) TEM images of four amorphous NMs synthesized in vitro at pH 7.5 with their corresponding elements labeled in dark-gray circle.

