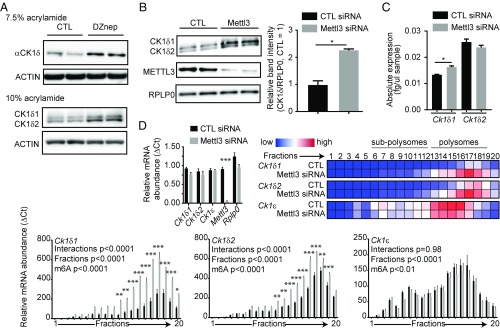
Fig. 1.
Two Ck1δ alternative transcripts are under m6A control. (A) A 50-μM DZnep treatment for 2 h increased CK1δ protein levels, and two CK1δ isoforms were observed when run on a 10% acrylamide gel. ACTIN was used as a loading control. (B) Mettl3 silencing increases CK1δ protein levels. Knock-down of METTL3 was confirmed, and RPLP0 was used as a loading control. (Right) Quantification of the total intensity of CK1δ bands relative to RPLP0, analyzed by Student t test, shown as mean ± SD, *P < 0.05. (C) Mettl3 silencing causes little changes in Ck1δ mRNA steady-state levels. Only Ck1δ1 showed a mild but significant increase. Data for each transcript were analyzed by Student t test and are shown as mean ± SEM, n = 3, *P < 0.05. (D) Mettl3 silencing increases the translated fraction of Ck1δ transcripts. (Top Right) Heatmap visualization of mean relative mRNA abundance for each transcript in each fraction. (Top Left) Quantification of transcripts in input cytoplasmic lysates, showing significant knock-down of Mettl3 but no significant differences in Ck1δ1, Ck1δ2, Ck1ε, and Rplp0 mRNA levels; ΔCT data, analyzed by multiple t tests, are shown as mean ± SEM, n = 3, ***P < 0.001. (Bottom) Bar charts show mean ΔCT ± SEM of indicated transcripts in each fraction, with significance levels in two-way ANOVA followed by Bonferroni post hoc test, n = 3, *P < 0.05, **P < 0.01, ***P < 0.001.

