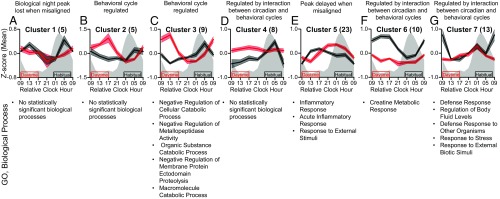
Fig. 3.
Plasma proteins with altered 24-h time-of-day patterns between circadian misalignment and alignment. A–G show statistically significant (P < 0.05) clusters derived from the 76 proteins with different 24-h time-of-day patterns when circadian misaligned versus aligned as identified by EDGE and DODR analyses. (Upper) Represent mean z-score (±SEM) data based on all proteins within each cluster. The number of proteins in each cluster is indicated in parentheses. Gray shading and black and red boxes and lines are as in Fig. 1. Data for relative clock hour 0900 are replotted for visual purposes only and were not used for any analyses. (Lower) The top five GO biological processes (ranked by P value) associated with the set of proteins within each cluster. Enriched biological processes were nominally statistically significant at the P < 0.05 level.

