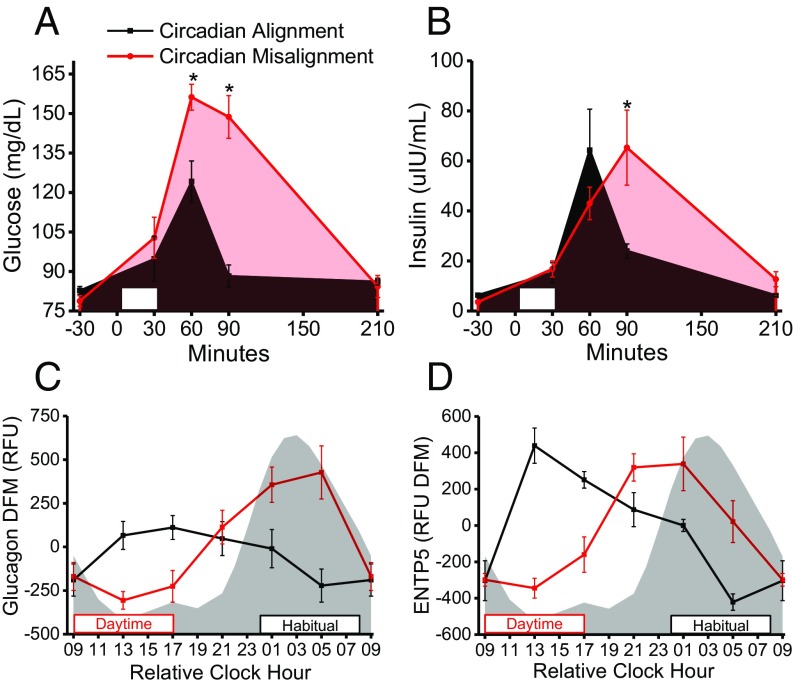
Fig. 5.
Effects of circadian misalignment on glucose homeostasis and associated proteins (n = 6). (A and B) Postprandial plasma glucose (study day, P = 0.01; study day × time, P = 0.00003; mixed-model ANOVA) (A) and postprandial plasma insulin (study day × time, P = 0.02; mixed-model ANOVA) (B) following fixed breakfast meals. White rectangles represent the time (30 min) allocated to ingest the breakfast meal. (C) Plasma glucagon measured from the proteomics platform. (D) Plasma ENTP5 measured from the proteomics platform. Gray shading and black and red boxes and lines are as in Fig. 1. *P < 0.05 versus circadian alignment at same time point for glucose and insulin (one-tailed t test). Glucagon (EDGE; FDR = 0.002) and ENTP5 (EDGE; FDR = 0.002) have significantly different 24-h time-of-day patterns when circadian misaligned versus aligned. Data are mean ± SEM. The difference from mean (DFM) was calculated for each subject individually using the grand mean of all samples within each individual subject. Data for relative clock hour 0900 are as in Fig. 3.

