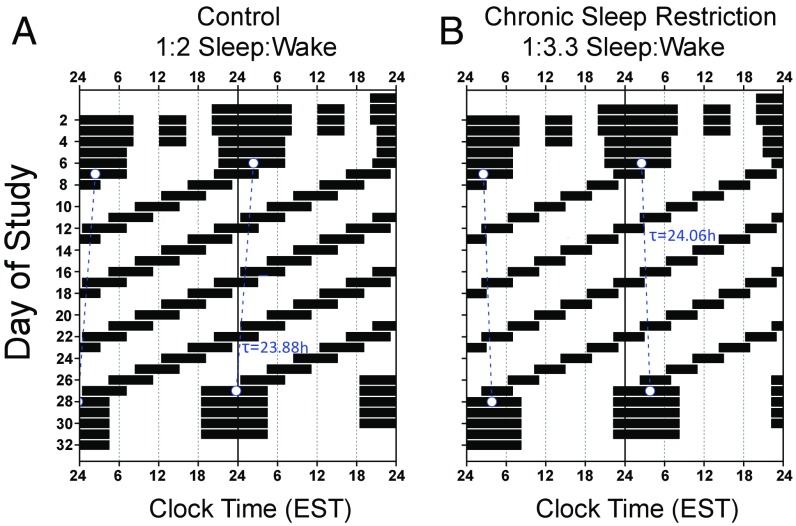
Fig. 1.
Raster plot of a (A) control (n = 8, 1:2 sleep:wake ratio) and (B) chronic sleep restriction (n = 9, 1:3.3 sleep:wake ratio) participant’s forced desynchrony protocol. Time is plotted on the horizontal axis and day of study is on the vertical axis. Days are double plotted such that each consecutive study day is plotted next to and below the previous day. Black bars represent sleep opportunities, and the blue dashed line represents each participant’s circadian period as derived from melatonin.

