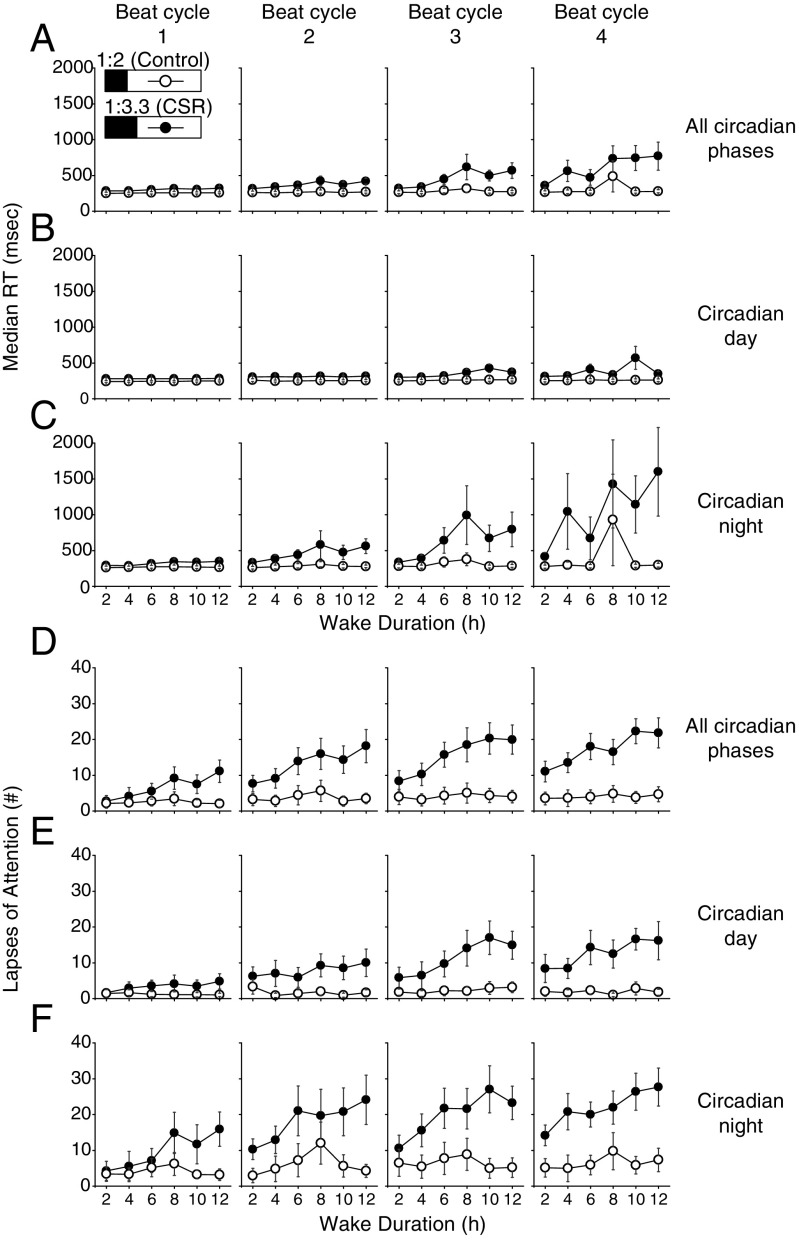
Fig. 4.
Acute and chronic impact of sleep restriction on PVT performance during the circadian day and night. The control (n = 8, 1:2 sleep:wake ratio) condition is denoted by open circles and the CSR (n = 9, 1:3.3 sleep:wake ratio) condition is denoted by closed circles. Higher median RT and number of lapses indicate worse PVT performance. Beat cycles (i.e., time to complete a cycle of circadian and sleep:wake schedule combinations, which was ∼6 protocol days in this forced desynchrony design) of the protocol are shown from Left to Right. Data are presented across wake duration for tests performed at all circadian phases (A and D) and during the circadian day (B and E) and circadian night (C and F). Error bars represent SEM.

