Fig. 4.
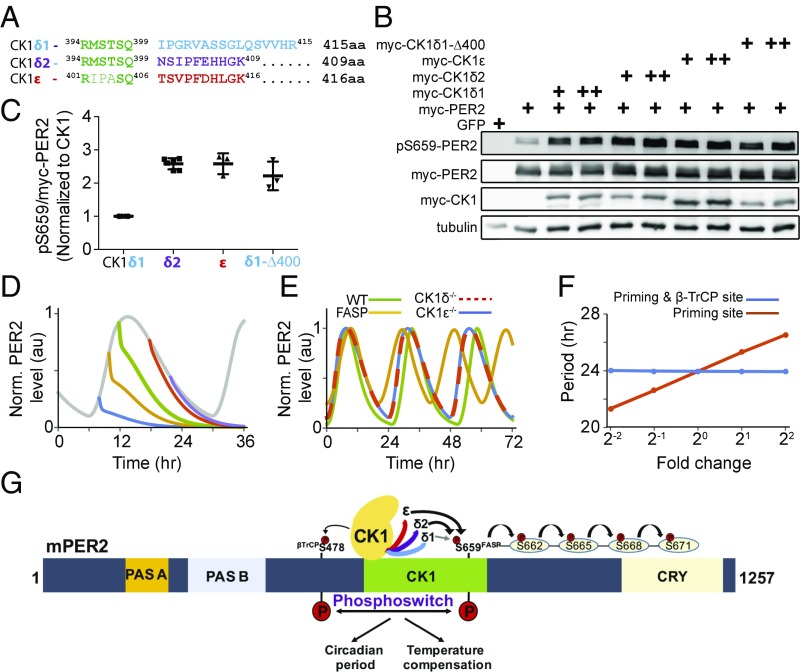
The extreme carboxyl terminus of CK1 regulates priming phosphorylation. (A) Alignment of the carboxyl termini of CK1δ1, CK1δ2, and CK1ε. (B) CK1δ2 and CK1ε are more-active priming kinases than the CK1δ1. mPer2 plasmid (1 µg) was cotransfected with 5 ng (+) and 10 ng (++) of indicated CK1 isoforms, and lysates were probed with indicated antibodies. The experiment was performed multiple times, with similar results. (C) Quantitative analysis of the priming kinase activity of CK1 isoforms. The ratio of pS659 to myc-PER2 was calculated after normalization to CK1 expression, and the value of CK1δ1 was taken as 1 to express fold change. n = 6 lanes for CK1δ1 and CK1δ2; n = 3 for CK1ε and CK1δ1-D400. (D) The identified priming kinases recapitulate the phosphoswitch model. Here, translation rates of the model are exponentially decreased with a half-life (∼0.13 h) after cycloheximide treatment at various timings. (E) The model accurately simulates various CK1 mutation phenotypes (13, 18, 33). (F) Phosphorylation of the FASP site has a profound impact on period. Period is robust to global changes in CK1 phosphorylation activity but sensitive to isolated change of the phosphorylation rate on the priming site. Here, the model parameters, kri (i = 1, 2) and/or kpo, are changed in the same magnitudes (SI Appendix, Table S3). (G) CK1δ2 and CK1ε are more-active priming kinases than CK1δ1. Diagrammatic representation of the mPER2 protein shows PAS-A and PAS-B domains and the CK1 and CRY binding regions.

