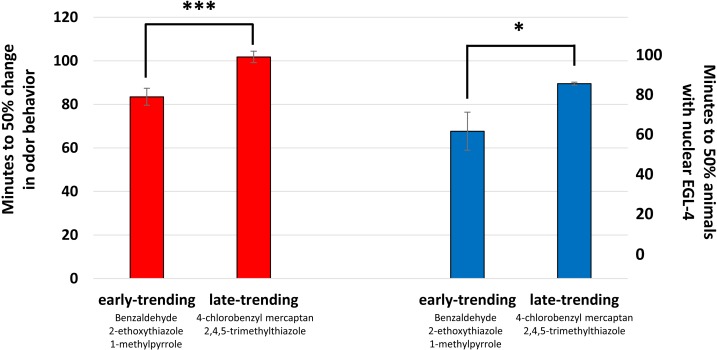
Figure 5. Timing of behavior change and EGL-4 nuclear accumulation in response to early and late-trending odors.
The time to 50% behavior change to early-trending and late-trending odors is indicated by the red bars, and the time to 50% of animals with nuclear EGL-4 after exposure to early-trending and late-trending odors is indicated by the blue bars. Error bars indicate standard deviation. Significance was determined by student’s T-test analysis. * indicates p < 0.05, *** indicates p < 0.001.

