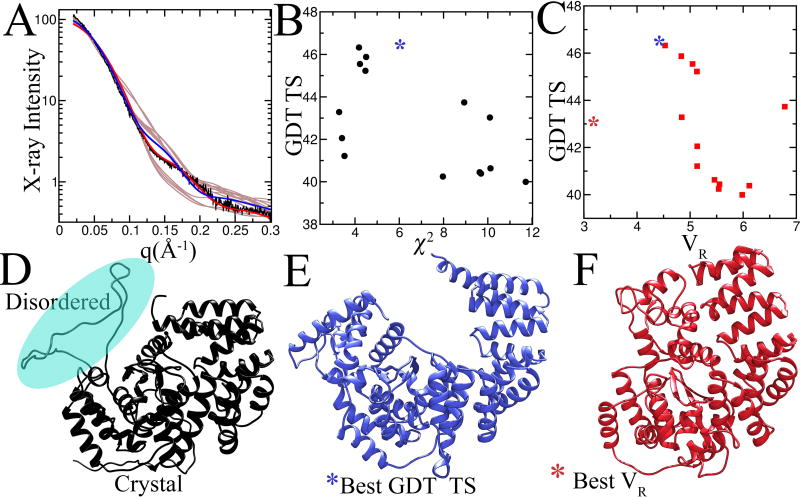
Figure 6. SAXS as a measure of the quality of prediction using χ2 and VR.
The calculated SAXS profile from the top 19 GDT_TS scored unassisted predictions for target Ts0942 were compared against the measured SAXS profile (A). The agreement between the experimental data and data predicted from the models was scored using χ2 (A) and VR (B) and plotted against GDT_TS. (D) The full-length model based on the crystal structure that best matches the experimental SAXS. The modeled region is highlighted by cyan sphere. (E) The highest GDT_TS scored model has a cavity not found in the full-length model. (F) The highest VR-scored model captures the overall shape of the full-length model.

