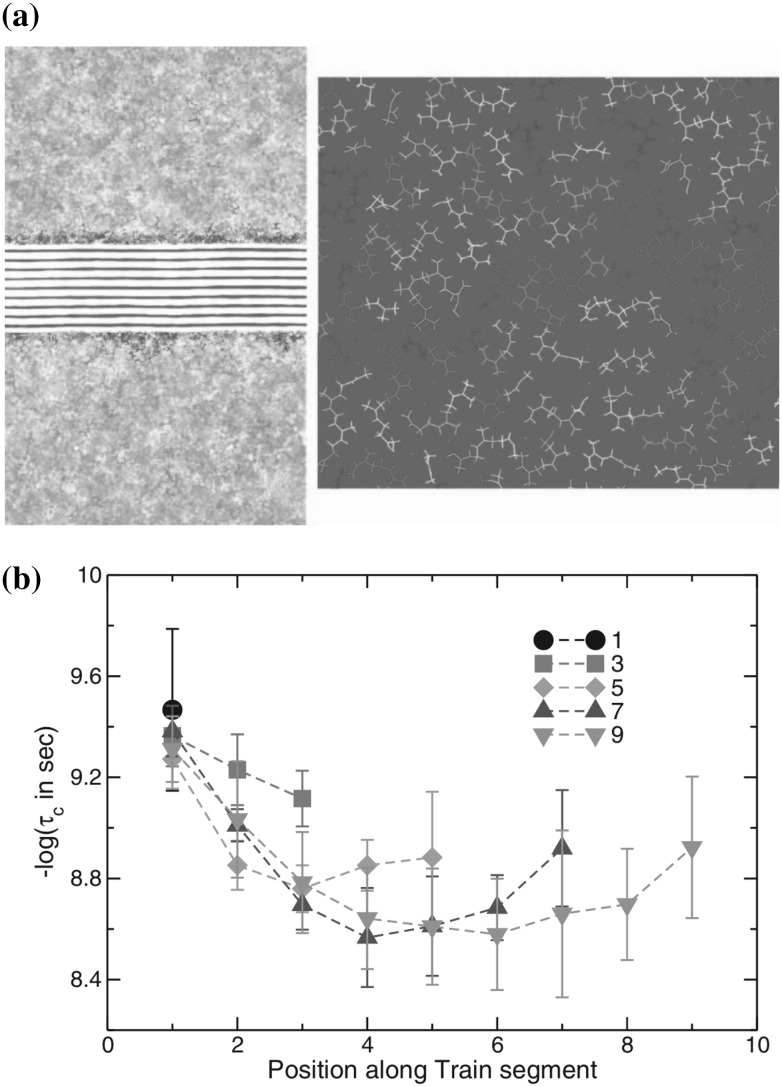
Fig. 22.
a Visual representation of the distribution of along the normal to the surface and on the surface of graphene planes ( is average per slab relaxation time of the c–CH bonds). Each repeat unit is colored with a scheme where red corresponds to the faster segments and blue to the slowest. b Average dynamics of repeat units on graphite along a train segment as a function of the length of it. (Color figure online) (Reprinted from [245], with the permission of AIP Publishing.)

