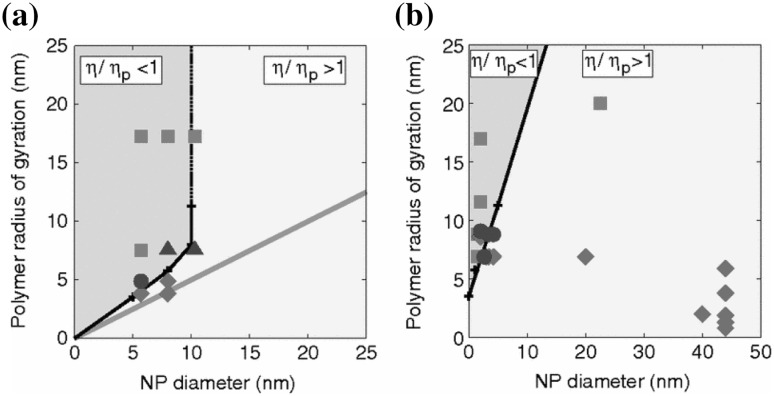
Fig. 31.
Viscosity of polymer nanocomposites as a function of the polymer radius of gyration and nanoparticle diameter. Square symbols correspond to , diamonds to , circles to at low nanoparticle loading, and triangles to the case where an initial increase of viscosity with nanoparticle loading is followed by a decrease. a Experimental data for athermal systems are from [208, 284]. Systems above the solid orange line should be miscible. The black “viscosity” line is extrapolated from the simulation findings. b Corresponding plot for dissimilar mixtures. Only the viscosity line is shown, Data are from [287–293] (Reprinted figure with permission from [196]. Copyright 2001 by the American Physical Society)

