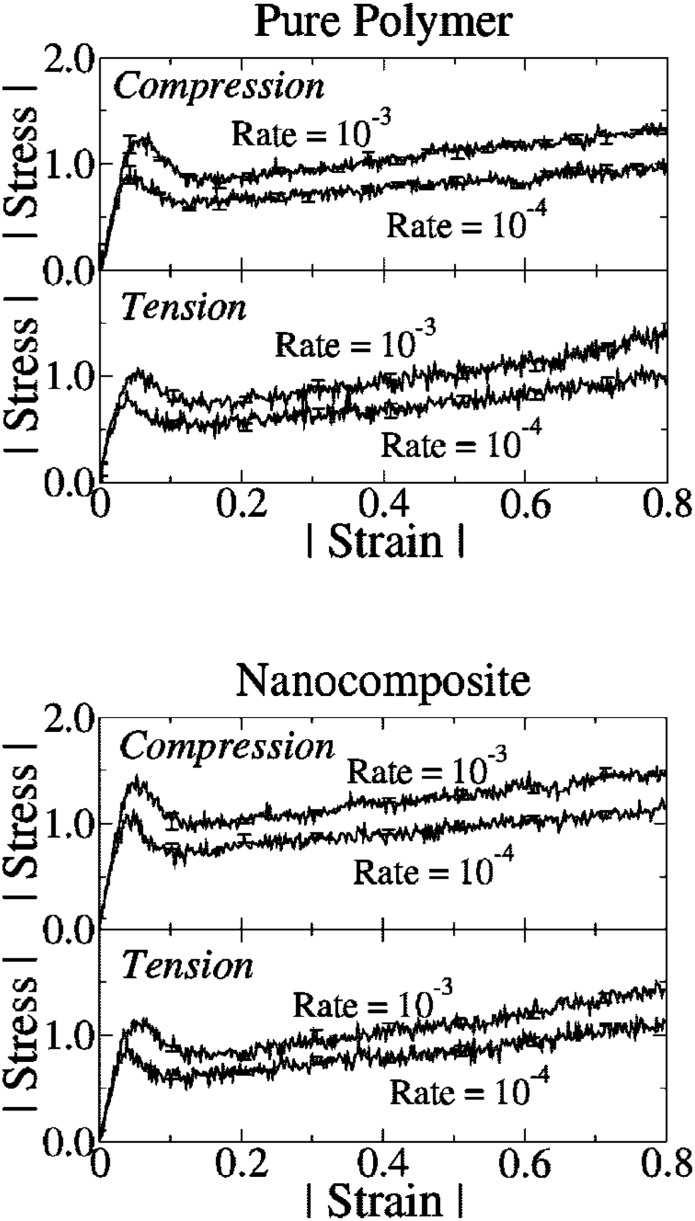
Fig. 37.
Stress-strain curves for both the pure polymer and the nanocomposite at two true strain rates in both tension and compression. The strain rates are indicated in each figure. Error bars are indicative. (Reprinted with permission from Ref. [325]. Copyright (2009) American Chemical Society.)

