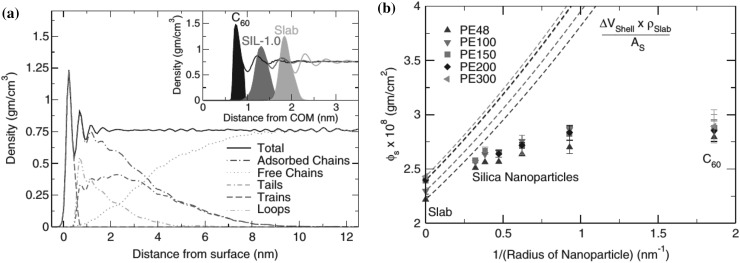
Fig. 5.
a Density distribution of a polyethylene melt as a function of distance from the surface of a filler (graphite slab, silica nanoparticle or fullerene C). The decomposition into tails, trains and loops is carried out following Scheutjens and Fleer [164]. The inset provides profiles for selected systems. b Surface concentration together with predictions based upon geometrical arguments for ideal spheres and surface monomer density in the proximity of silica slabs. (Reprinted from [159], with the permission of AIP Publishing.)

