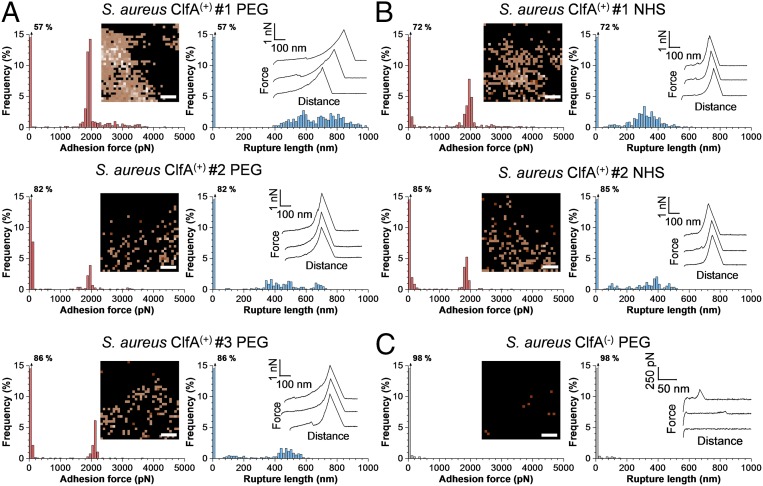
Fig. 3.
Binding strength of single ClfA–Fg bonds in living S. aureus bacteria. (A, Left) Maximum adhesion force histograms with force maps (Insets). (Scale bars: 100 nm.) (Right) Rupture length histograms with representative retraction force profiles (Insets) obtained by recording force-distance curves in PBS between three different S. aureus ClfA(+) cells and AFM tips functionalized with Fg using PEG chemistry. (B) Data obtained in the same conditions between two different S. aureus ClfA(+) cells and AFM tips functionalized with Fg using NHS chemistry. (C) Force data between a S. aureus ClfA(−) cell and a AFM tip functionalized with Fg using the PEG chemistry.

