Fig. 4.
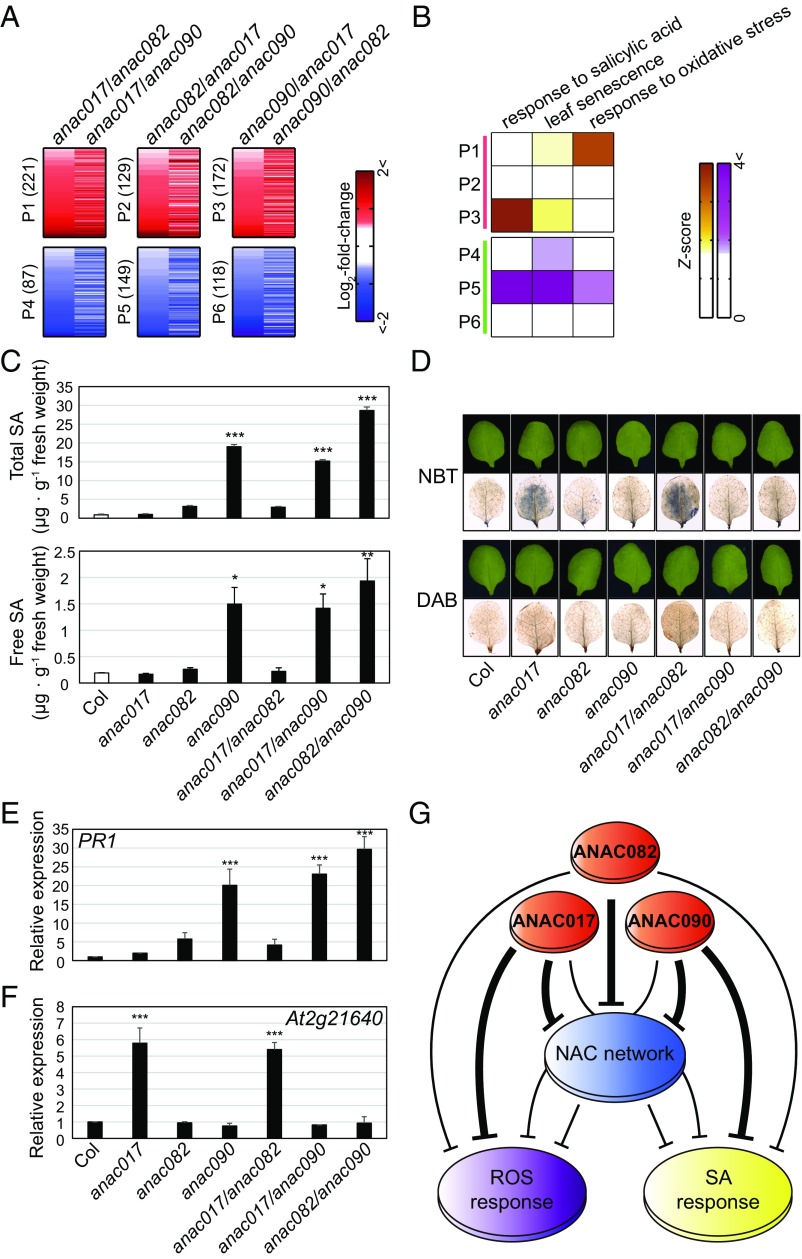
ANAC017 and ANAC090 differentially regulate ROS and SA responses. (A) Heat maps showing up-regulation (red) and down-regulation (blue) of genes predominantly in anac017 (P1 and P4), anac082 (P2 and P5), or anac090 (P3 and P6) mutants. These genes were identified from the following comparisons: for P1 and P4, anac017 vs. anac082 (anac017/anac082) and anac017 vs. anac090 (anac017/anac090); for P2 and P5, anac082 vs. anac017 (anac082/anac017) and anac082 vs. anac090 (anac082/anac090); and for P3 and P6, anac090 vs. anac017 (anac090/anac017) and anac090 vs. anac082 (anac090/anac082). The number of genes in each pattern is denoted in parenthesis. The color bar represents the gradient of log2 fold changes from each comparison. (B) Representative aging-associated GOBPs enriched by genes in P1–6. The color bar represents the Z-score gradient representing enrichment significance (P value): Z = N−1(1 − P) where N−1 is the inverse standard normal distribution and P is the enrichment P value. (C) Endogenous levels of free SA and total SA (free SA + SA glucosides) measured from the third or fourth leaves of wild-type (Col) plants, single mutants, and double mutants at 18 d of leaf age. Values are means ± SE (n = 3). (D) Staining of O2− and H2O2 in the third or fourth leaves of wild-type plants, single mutants, and double mutants at 18 d of leaf age using nitroblue tetrazolium (NBT) and diaminobenzidine tetrahydrochloride (DAB), respectively. (E and F) mRNA expression levels of PR1 (E) and At2g21640 (F) in leaves from wild-type (Col) plants, single mutants, and double mutants at 18 d of leaf age. mRNA expression levels were analyzed by qRT-PCR and then were normalized by those of ACT2. For each gene, the normalized expression levels were further normalized by those in wild-type plants. Values are means ± SD (n = 4). (G) A proposed model for shared and differential regulation by the NAC troika of SA and ROS responses. SA levels and the normalized expression levels were compared using one-way ANOVA with Dunnett's correction as a post hoc test. *P < 0.05; **P < 0.01; ***P < 0.001.

