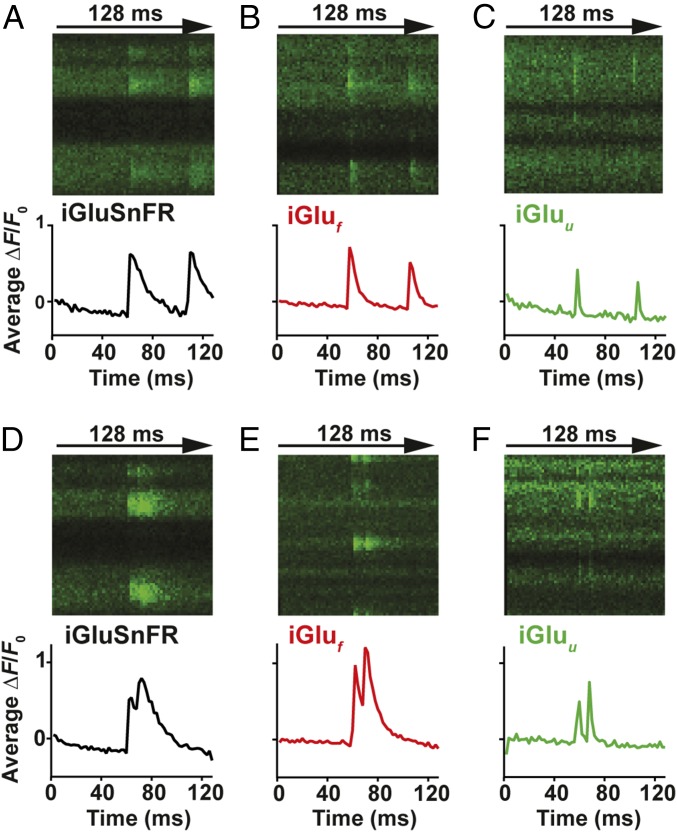
Fig. 2.
Imaging glutamate release from single presynaptic terminals. Spiral line scans at 500 Hz were used to cover the entire surface of individual boutons, intersecting the release site multiple times. Averages of three to six responses of iGluSnFR (A and D), iGluf (B and E), and iGluu-expressing (C and F) boutons stimulated by two somatic APs at 48-ms (A–C) and 10-ms interstimulus intervals (D–F).

