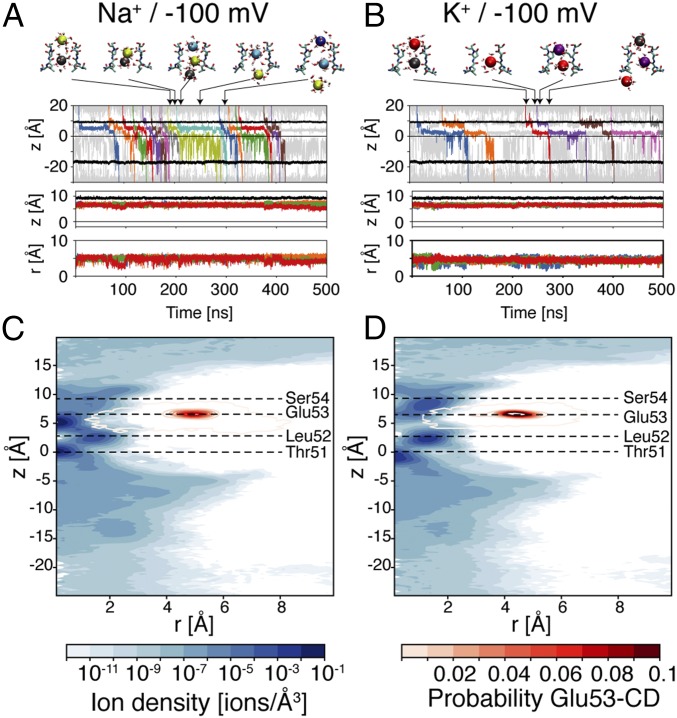
Fig. 1.
Conduction with membrane potential at −100 mV. (A and B) Trajectory of ions and Glu53 residues in simulations with Na+ and K+, respectively. (Top) Ion positions along the axis of the channel (z axis). The trajectories of ions that cross the channel from side to side are shown using lines in different colors. Thin gray lines are used for any other ion in the system that is closer than 12 Å from the channel axis. Other ions are not shown. The black lines show the position of the center of mass of Ala90 residues (intracellular entrance of the channel) and of the side chain oxygens of Ser54 residues (extracellular entrance of the selectivity filter). The zero of the z axis corresponds to the center of the carbonyl oxygen atoms of Thr51 residues. Representative snapshots of the selectivity filter (residues 51–54 of only two opposing subunits in licorice representation), with the permeating ions (VDW representation), and surrounding water molecules (licorice representation) are shown in Top. The colors used for the ions correspond to the ones adopted in the plot. (Middle and Bottom) Trajectories of the carbon atom of the carboxyl group of Glu53 residues respectively along the z axis and in the radial direction. The radial coordinate was defined as the distance on the x–y plane from the center of mass of the carbonyl oxygen atoms of Thr51 residues. (C and D) Distribution of ions and Glu53 residues in simulations with Na+ and K+ respectively. MD trajectories were sampled with a period of 10 ps. The average positions of the carbonyl oxygen atoms of Thr51 and Leu52, the carbon atoms of the carboxyl group of Glu53, and the side-chain oxygen atoms of Ser54 are highlighted by horizontal dashed lines. The z and the r axes were discretized in bins with side equal to 0.25 Å, and the average number of ions and carbon atom of the carboxyl group of Glu53 (CD atom) residues were computed for each bin. This average number of particles per bin was divided by the volume of the bin to get the densities of ions (blue maps) and of CD atoms (red contour plots).

