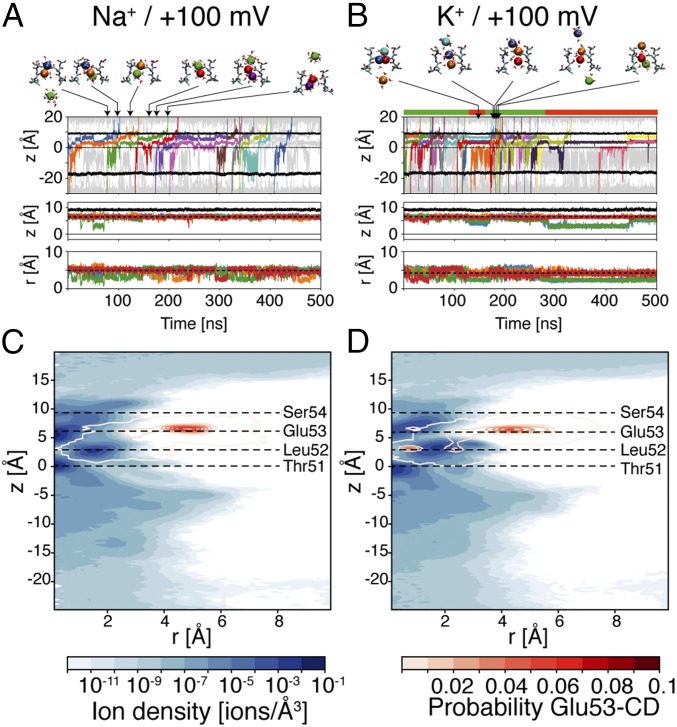
Fig. 2.
Conduction with membrane potential at +100 mV. Same legend as Fig. 1. The dashed lines in Middle and Bottom (A and B) show the average position of the carbon atom of the carboxyl group of Glu53 residues along the axial and radial directions, respectively, in simulations with the same ion species and membrane potential at −100 mV. The color bar above B shows the most likely metastable state of the MSM; green corresponds to EOUT, and red corresponds to EIN.

