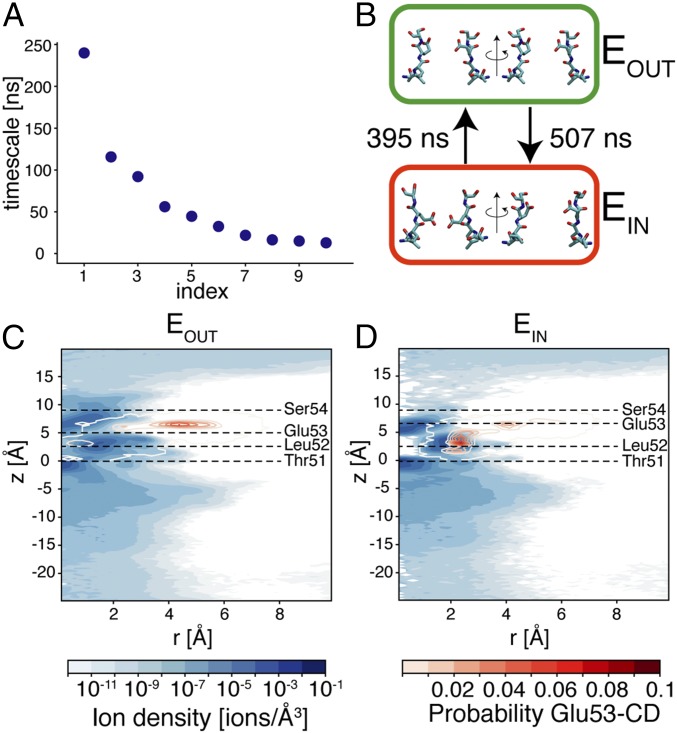
Fig. 3.
Markov state model of the selectivity filter. (A) Estimated relaxation times of the MSM. (B) Representative configurations of the selectivity filter in metastable states EIN (red box) and EOUT (green box). Two alternative views of residues 51–54 (rotated by 90° around the axis of the channel) are shown for two opposite subunits. Mean first passage times between the two metastable states are provided. (C and D) Distribution of ions (blue maps) and of carbon atom of the carboxyl group of Glu53 residues (red contour plots) in metastable states EOUT and EIN, respectively, calculated as described in the legend of Fig. 1.

