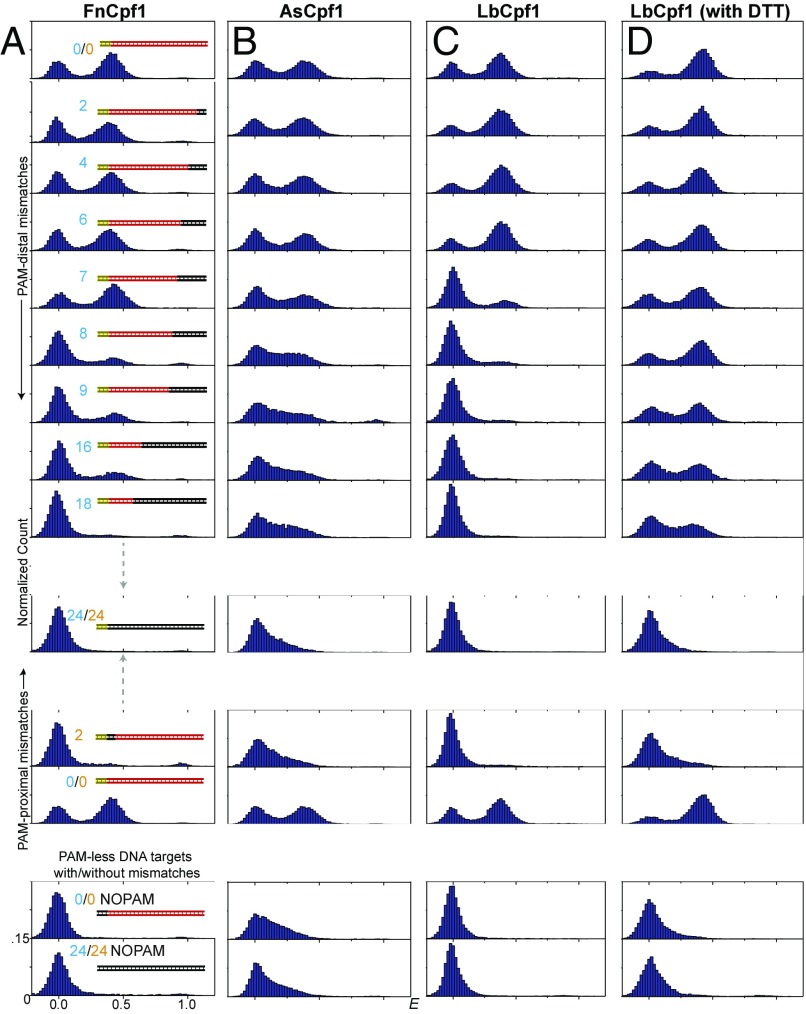
Fig. 2.
E histograms during DNA interrogation by Cpf1-RNA. (A) FnCpf1. (B) AsCpf1. (C) LbCpf1. (D) LbCpf1 (in reducing conditions of 5 mM DTT). The number of PAM-distal (nPD) and PAM-proximal mismatches (nPP) is shown in cyan and orange respectively. [Cpf1-RNA] = 50 nM. The third peak at high FRET efficiencies occurred in only some experiments and was the result of fluorescent impurities likely due to variations in PEG passivation, and they were difficult to exclude in automated analysis.

