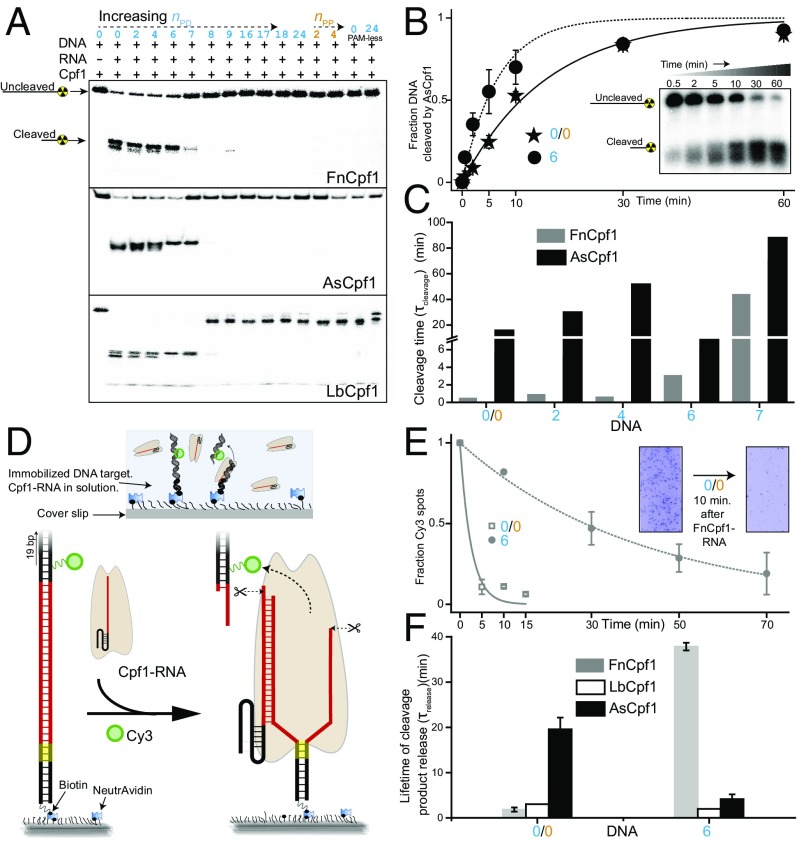
Fig. 4.
DNA cleavage and product release. (A) Cpf1 induced DNA cleavage at room temperature analyzed by 10% denaturing polyacrylamide gel electrophoresis of radio-labeled DNA targets. (B) Fraction of DNA cleaved by AsCpf1 vs. time for cognate and DNA with nPD = 6, and single-exponential fits. A representative gel image is shown in the Inset. (C) Cleavage time (τcleavage) determined from cleavage time courses as shown in B. (D) Schematic of single-molecule cleavage product release assay. PAM-distal cleavage product release can be detected as the disappearance of the fluorescence signal from Cy3 attached to the PAM-distal product. (E) Average fraction of Cy3 spots remaining vs. time for FnCpf1-RNA (50 nM). The Inset shows images before and after 10-min reaction. (F) Average time of cleavage product release (τrelease).

