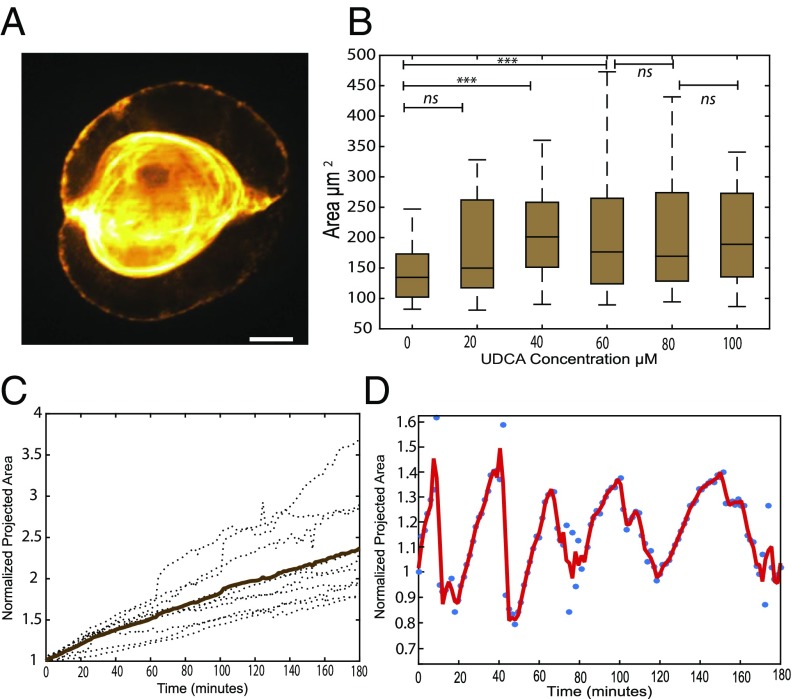
Fig. 1.
Lumen morphology and dynamics. (A) Structured illumination image of a typical bile canaliculi creating a lumen between two hepatocytes. (Scale bar, 2 m.) (B) Increase of a projected area of canaliculi at steady state upon continuous bile secretion stimulation by a different dose of UDCA (n = 20 for each dose). Student test: ***P < 0.0001; ns, nonsignificant. (C) Linear growth of the canaliculi (dotted line, individual cell; bold line, average) under reduced contractility condition (1 M blebbistatin). (D) Sustained oscillatory dynamics under native contractility conditions. Bile canaliculi in the projected area are normalized by their size at t = 0.

