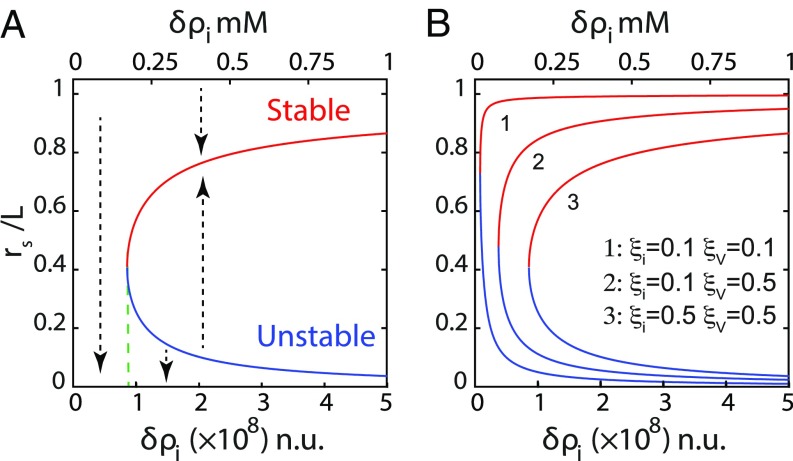
Fig. 3.
Lumens at steady state. (A) The steady state size of the lumen as a function of pumping efficiency displays an unstable and a stable branch represented in blue and red, respectively (). The dashed arrows represent the direction of variation of lumen radius for any deviation from its steady state value. There is no stable state lumen at low enough pumping efficiency . Any lumen of any size would shrink off. Above a critical , any small lumen above the unstable branch will grow to finally reach a larger steady lumen size. (B) Variation of the steady lumen size as a function of lumen efficiency for different screening lengths and .

