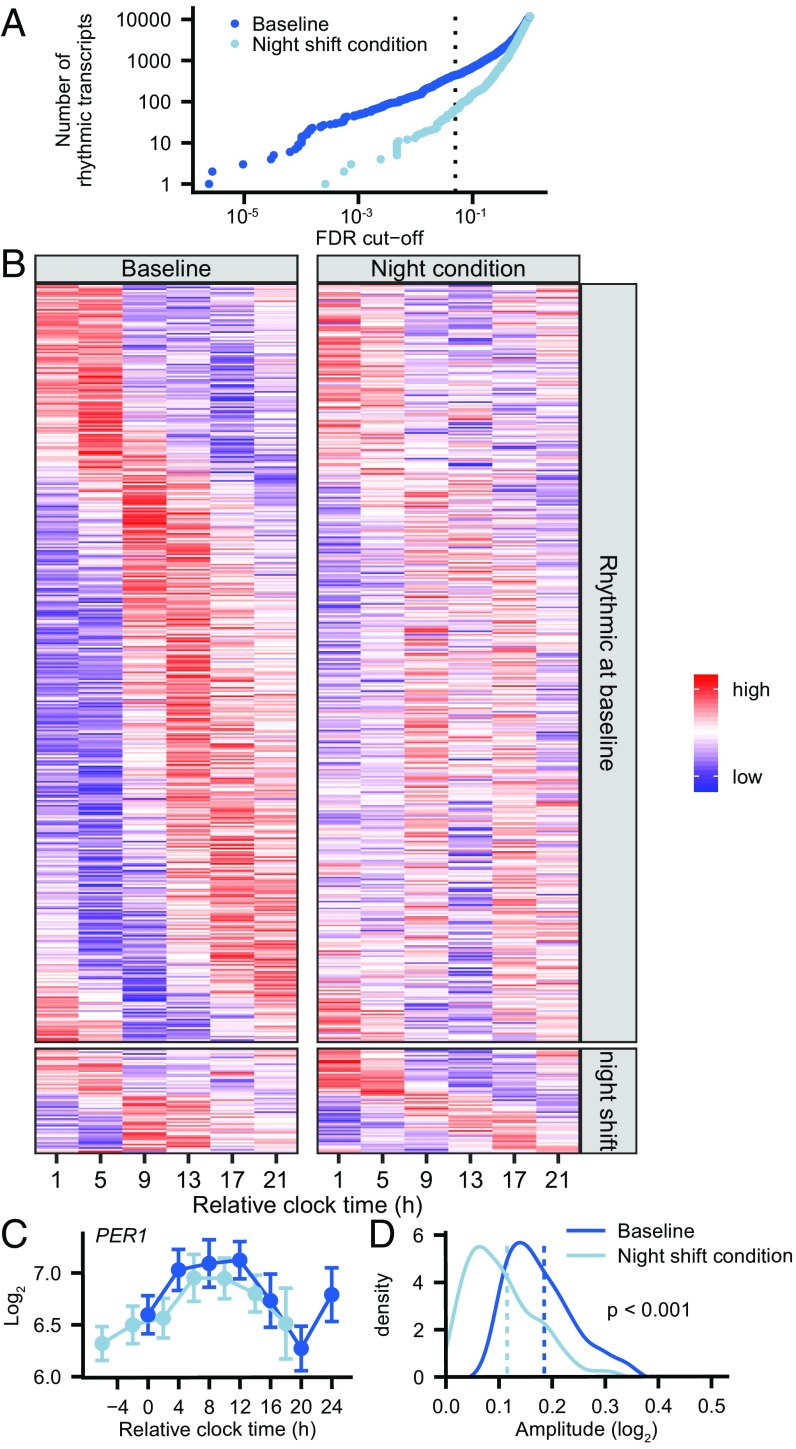
Fig. 2.
Group-level cosinor analysis. (A) Number of rhythmic transcripts identified at baseline and during the night shift condition across the continuum of FDR cutoffs. The dotted vertical line represents an FDR cutoff of 0.05. (B) Heatmap showing the expression profiles during baseline (Left) and the night shift condition (Right) of probe sets that are rhythmic at baseline (Top) and during the night shift condition (Bottom). Rows are ordered by phase of the peak expression, as determined by cosinor analysis. (C) Example of the expression profile (mean ± SEM) of a transcript (PER1) that is identified as significantly rhythmic at baseline but not during the night shift condition. (D) Comparison of amplitude of all 471 probe sets that are rhythmic either at baseline and during the night shift condition as identified by group-level cosinor analysis on the two conditions separately. Amplitudes in the night shift condition [0.115 (0.077); mean (SD)] were significantly lower than those at baseline [0.185 (0.076); P < 0.0001, Mann–Whitney test]. Dotted lines show the mean amplitudes.

