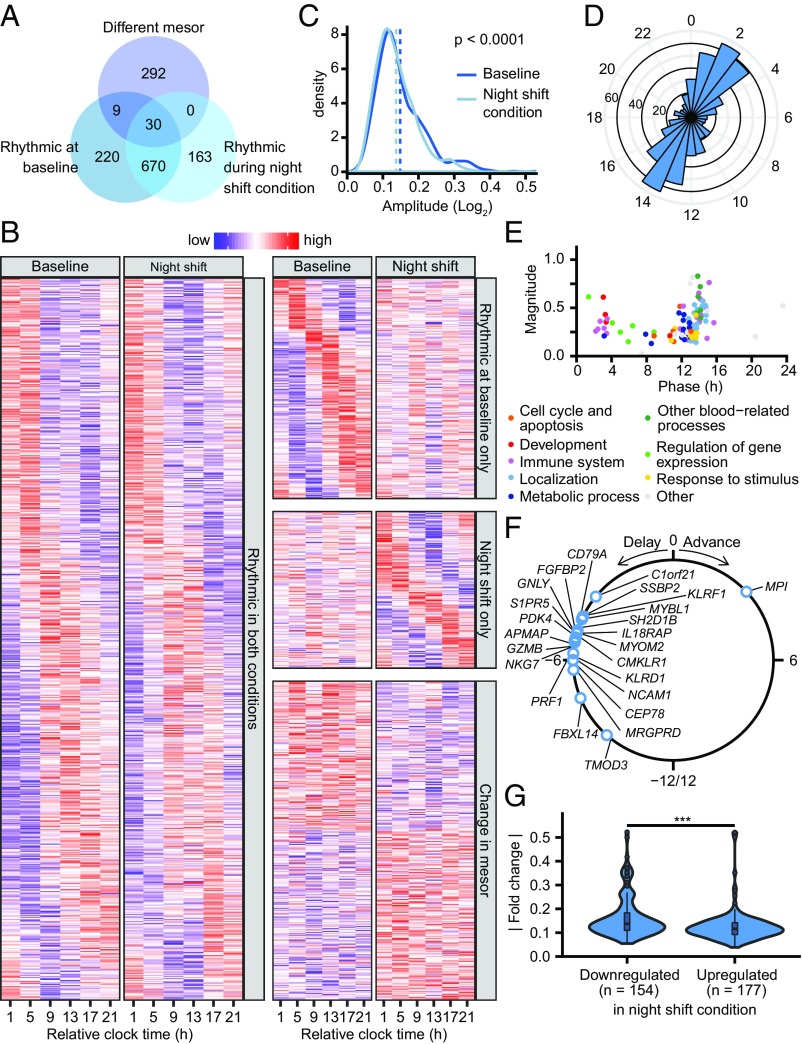
Fig. 4.
Effect of the simulated night shift protocol on rhythmic gene expression. (A) Venn diagram showing the number of probe sets rhythmic at baseline and during the night shift condition identified by the model selection approach, as well as probe sets that show a change in mesor (Fig. 3). (B) Heatmap of probe sets identified as having a rhythm in both conditions (Left; categories i, ii, iii, and iv in Fig. 3), a rhythm only at baseline (Top Right; categories v and vi), a rhythm only during the night shift condition (Middle Right; categories vii and viii), or an overall change in baseline levels (Bottom Right; categories ii, iv, vi, viii, and x). Rows are ordered by phase or the extent of up- or down-regulation. Note that the rows in the different panels are not mutually exclusive as some probe sets that are identified as rhythmic also show a change in mesor. (C) Density plot of the amplitude of transcripts that are significantly rhythmic both at baseline and during the night shift condition as estimated by cosinor analysis performed on both conditions separately. The mean amplitude (dotted vertical lines) is significantly reduced from 0.149 at baseline to 0.137 during the night shift condition (P < 0.0001, paired Mann–Whitney test). (D) Phase distribution of probe sets that are rhythmic in both conditions. (E) Magnitude and phase of enriched biological processes (q < 0.05 vs. uniform phase distribution) identified using phase set enrichment analysis, among transcripts that are rhythmic in both conditions, colored by functional category. (F) Change in phase of transcripts that show altered rhythmicity during the night shift condition relative to baseline (categories iii and iv in Fig. 3). (G) Distribution of absolute up- and down-regulation in the night shift condition compared with baseline. (***P < 0.001, Mann–Whitney test.)

