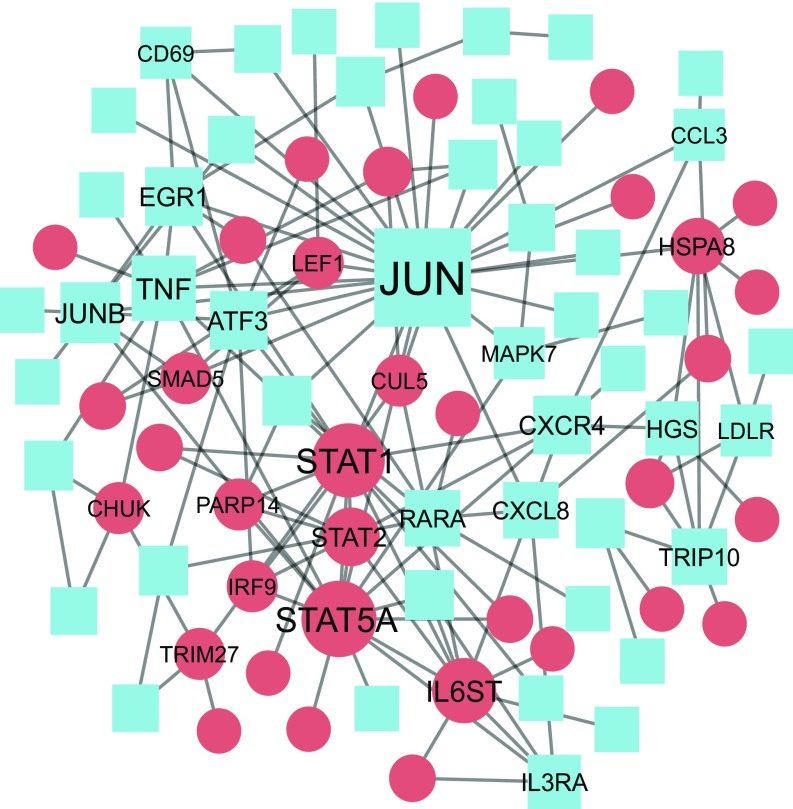
Fig. 5.
Functional interaction network of transcripts that were up-regulated and down-regulated during the night shift condition. Node size represents the number of connections within the network. Lines represent the functional interactions between gene products as identified in the Reactome database (version 2016). Red circles, up-regulated genes; blue squares, down-regulated genes. Transcript names are shown for transcripts with four or more connections.

