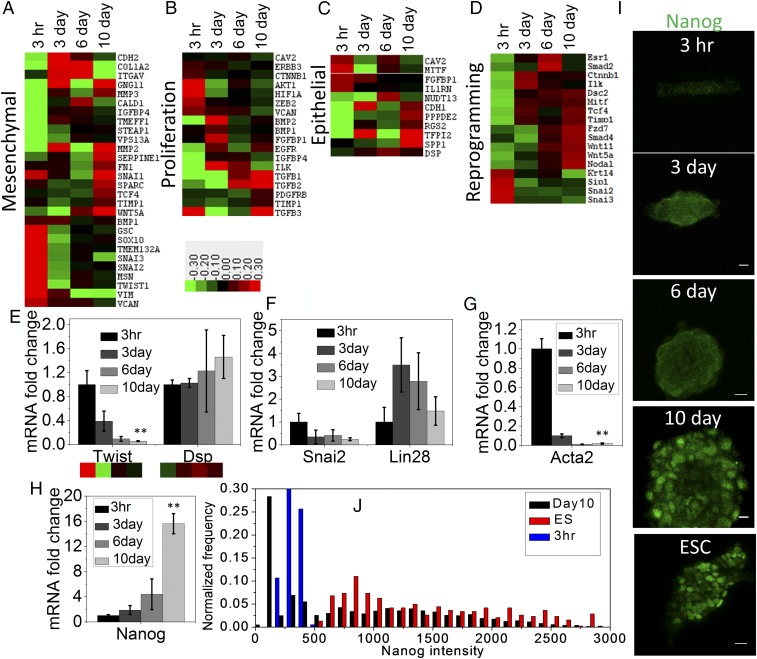
Fig. 2.
Time course transitions in epigenetic landscape facilitating nuclear reprogramming. Epitect ChIP-qPCR array for differential histone acetylation represented as heat maps shows relative changes of H3K9Ac occupancy at the promoter regions of genes characterizing (A) mesenchymal, (B) proliferation, (C) epithelium-like, and (D) reprogramming properties. Mean-normalized data were analyzed by Cluster 3.0. Ordering method is complete linkage. The heat map with clustering was acquired using Java Tree View. Positive, red; negative, green; zero, black. (E) Twist and Dsp mRNA in these four conditions obtained by qRT-PCR shows similar trend of their corresponding promoter occupancy of H3K9Ac. Error bars represent SD; **P < 0.01; Student’s t test. (F) The mRNA level of two transcription factors Snai2 and Lin28 obtained by qRT-PCR associated with negative and positive regulation, respectively, in nuclear reprogramming. (G and H) The mRNA level of mesenchymal and ESC characteristic genes Acta2 (αSMA) and Nanog, respectively, normalized with respect to NIH 3T3 grown on RE for 3 h cells (n = 3 samples). Error bars represent SD; **P < 0.01; Student’s t test. (I) Representative Nanog immunofluorescence micrographs of NIH 3T3 cells grown under laterally confined conditions for 10 d on RE and mouse ESC. (Scale bars, 10 µm.) (J) Normalized frequency distribution plot of nuclear Nanog fluorescence intensity in 3 h rectangle cells, 10 d spheroids, and ESCs.

