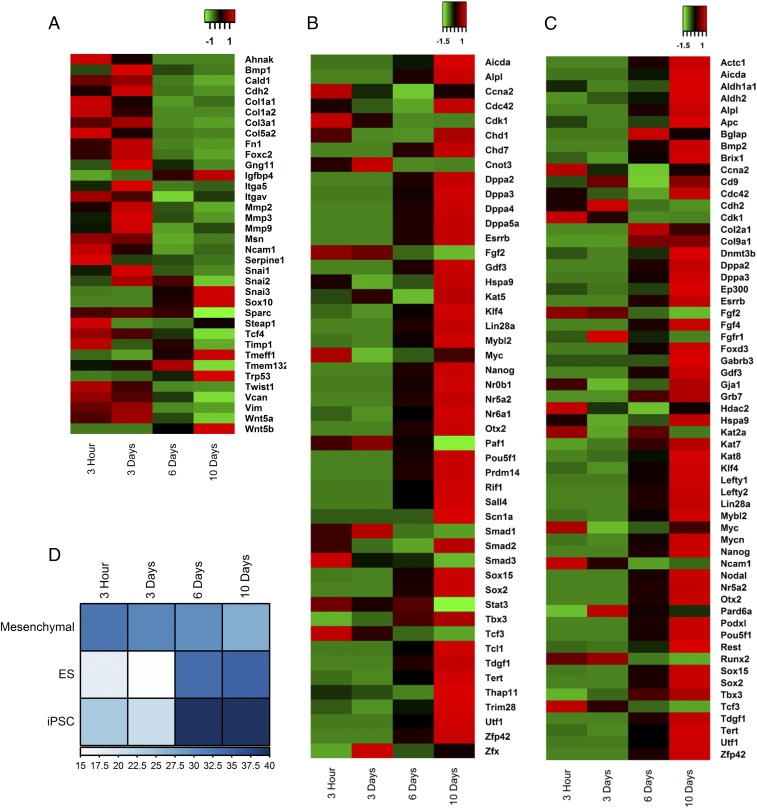
Fig. 3.
Temporal changes in the transcriptome during the nuclear reprogramming. Heat maps showing the relative gene expression patterns of (A) mesenchymal, (B) ESC (ES), and (C) iPSC genes. (D) A heat map representing the number of transcripts of candidate genes in the highly expressed transcripts (top 10%) in each sample.

