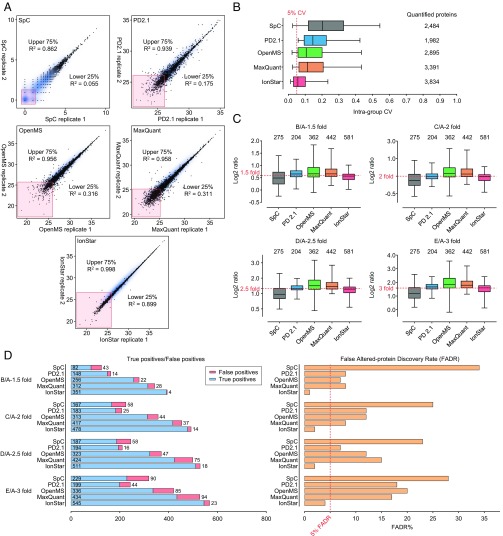
Fig. 4.
Comparison of quantitative quality among different approaches. (A) Reproducibility examined by Pearson correlation of two replicate runs from the same sample. The R2 values were separately calculated for proteins in the upper 75% and lower 25% abundance percentiles. Proteins with missing data were removed from comparison. (B) Quantitative precision of proteins quantified by each method, indicated by intragroup CV levels. (C) Quantitative accuracy of E. coli proteins quantified under all spike-in levels by each method. The true ratios are highlighted by red dotted lines. (D) Numbers of true and false positives (Left) in significantly changed proteins and FADR (Right) by each method. All spike-in levels are included.

