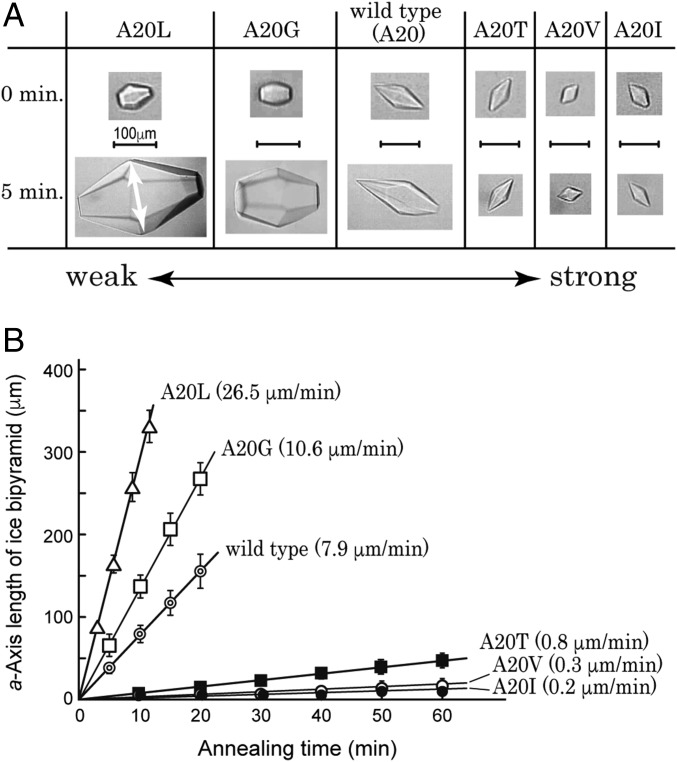
Fig. 2.
Comparison of the strength of ice-growth inhibition between WT and mutant proteins. (A) Images of bipyramidal ice crystals captured for A20L, A20G, WT, A20T, A20V, and A20I mutants before and after 5 min of annealing time. The arrow indicates the length of the a axis. (B) Dependence of the length of the a axis on the annealing time measured at the Tm − 0.05 °C with 0.2 °C/min of cooling. The larger growth rate (μm/min) implies a weaker ability for the ice to inhibit growth.

