. 2018 Mar 29;6(16):6882–6890. doi: 10.1039/c7ta11128b

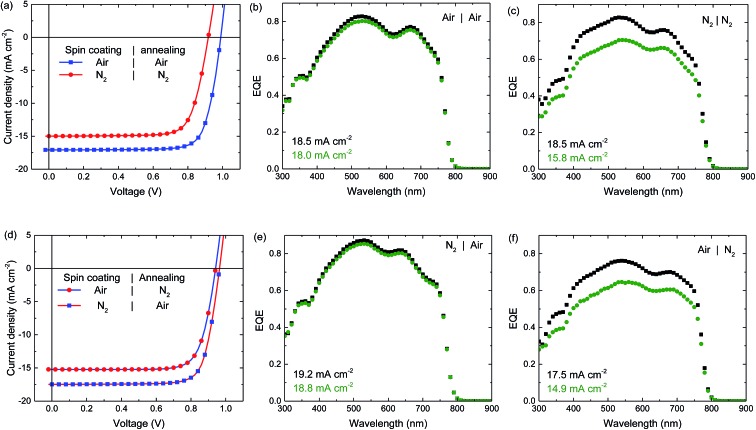
Fig. 1. Stabilized current density–voltage (JV) curves (a and d) under simulated AM1.5G illumination, and EQE spectra (b, c, e and f) of ITO/PEDOT:PSS/perovskite/PCBM/LiF/Al solar cells processed under different atmospheres as indicated in the legends. Black squares depict the EQE under low charge carrier density (i.e. without bias illumination), green circles depict the EQE at a charge carrier density similar to that of the cell under 1 sun light intensity (i.e. with bias illumination). The integrated current density is displayed in the graphs for both measurements. The dark JVs belonging to panel (a) are displayed in the ESI, Fig. S1. .

Fig. 1