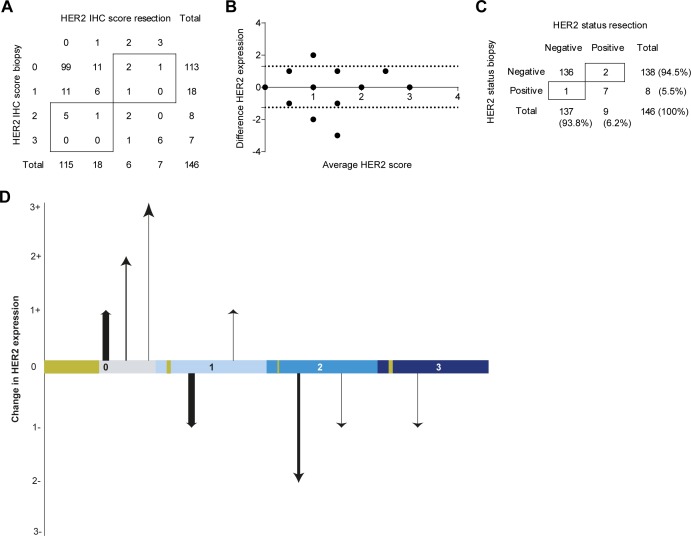
Figure 2.
HER2 assessment of the resectable disease cohort (i) nCRT treated patients and (A) HER2 protein expression scores of the biopsy and resection specimen according to the scoring system of Hoffman et al. (B) The absolute observed difference in HER2 protein expression between the biopsy and resection specimen vs. the mean of both observed scores (Bland-Altman curve) [12]. The dotted lines indicate the 95% Confidence Interval (CI). (C) HER2 status positivity or negativity scored according to the consensus guideline; IHC and an additional SISH performed on IHC 2+ tumor material. (D) The change in HER2 protein expression between biopsy and resection specimen (y-axis) depicted for each score of the biopsy (x-axis). The thickness of the arrows indicate the fraction of patients undergoing this change in expression dynamics. The golden blocks on the x-axis indicate the fraction of patients not undergoing any change in expression dynamics.

