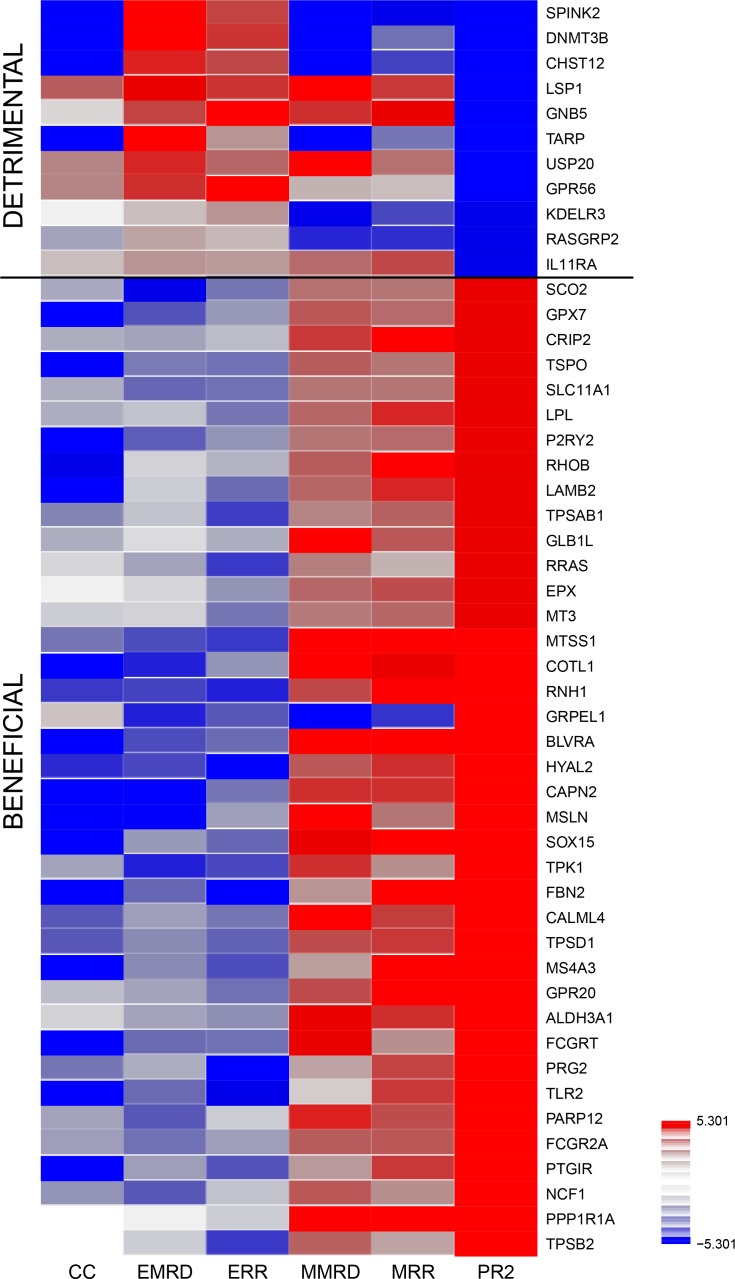
Figure 1. Therapeutically beneficial and detrimental patterns of association detected by the CC-PROMISE procedure.
Association Heatmap for top 50 genes by CC-PROMISE analysis. Each block of the heatmap illustrates the results of a statistical test of association. CC-PROMISE identified 11 genes for which increased expression associated with poorer prognosis (detrimental) and 39 for which increased expression associated with better prognosis (beneficial). The color indicates the direction of association (red = positive; blue = negative) and the intensity represents statistical significance on the log10 p-value scale. Each row provides association analysis results for one gene. The columns provide results for the associations of methylation with expression (ME), expression and MRD (EMRD), expression and RR (ERR), methylation and MRD (MMRD), methylation and MRD (MMRD) and the integrated CC-PROMISE result (CCPR). MRD: Minimal Residual Disease; RR: Risk of relapse or resistant disease.

