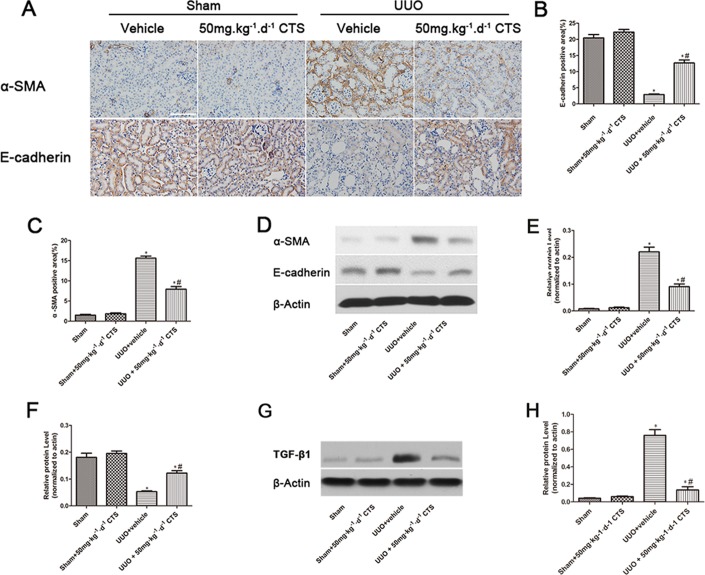
Figure 4. CTS blocks EMT in the seven-day UUO mouse model.
(A) Immunohistochemical images for the expression of E-cadherin and α-SMA, original magnification ×200; (B and C) Semiquantitative analysis for IHC staining of E-cadherin and α-SMA; (D) Representative images of Western blot for α-SMA and E-cadherin; (E and F) Semiquantitative analysis for Western blot of α-SMA and E-cadherin; (G) Representative images of Western blot for TGF-β1; (H) Semiquantitative analysis for Western blot of TGF-β1; *P < 0.05 vs. sham group, #P < 0.05 vs. UUO plus vehicle group. Scale bar, 200 μm.

