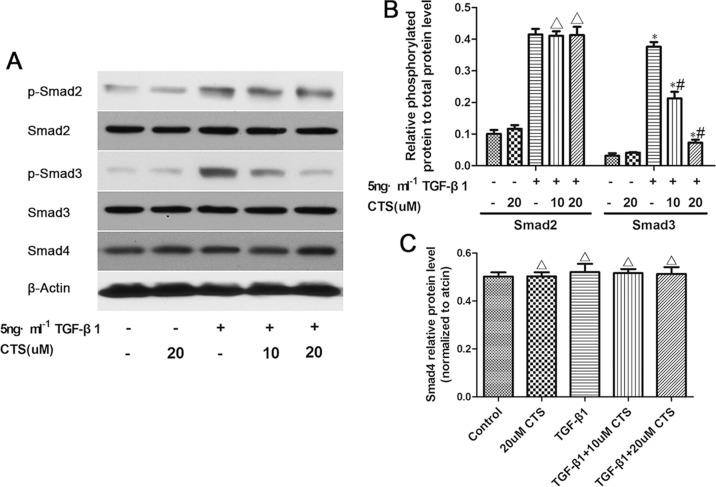
Figure 7. CTS selectively inhibits the phosphorylation of Smad3 but exhibits no effect on that of Smad2 or Smad4.
(A) Representative images of Western blot for p-Smad2, Smad2, p-Smad3, Smad3, and Smad4. (B) Semiquantitative analysis for Western blot of phosphorylated protein level to total protein level. (C) Semiquantitative analysis of Western blot for Smad4. *P < 0.05 vs. control, #P < 0.05 vs. the former group. ΔP > 0.05 vs. the former group.

