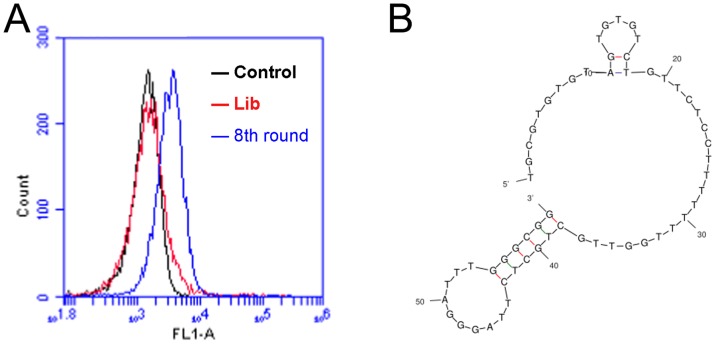
Figure 1. Flow cytometry monitoring of the enrichment of aptamers during selection.
(A) Compared with the initial random DNA pool (the red curve), flow cytometry revealed an increase in fluorescence intensity of DNAs bound to the CD19 protein in the 8th (the blue curve) rounds of selection. (B) The predicted secondary structure of aptamer LC1.

