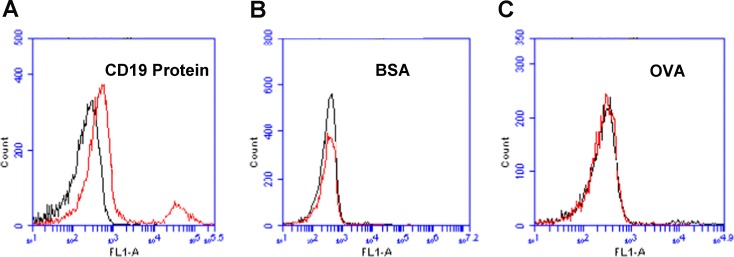
Figure 2. Flow cytometry assessments of the aptamer's binding to CD19 protein, BSA, or OVA.
(A) Beads coated with CD19 protein was treated with FITC-labeled aptamer. (B) BSA beads treated with FITC-labeled aptamer. (C) OVA beads treated with FITC-labeled aptamer. Black curves represent the control fluorescence signals generated by FITC-labeled random DNA from the library pool. Red curves are signals produced by aptamer LC1.

