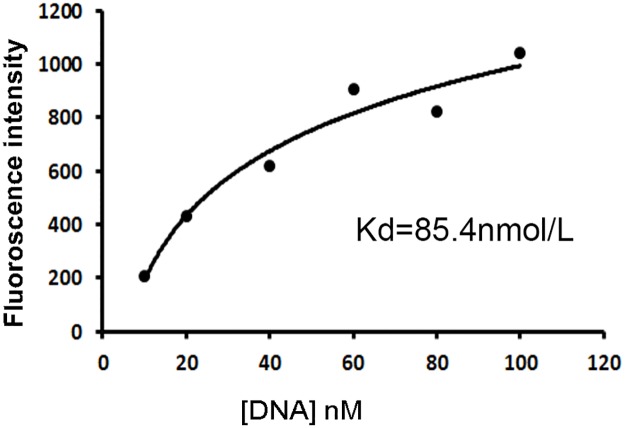
Figure 5. Quantitative evaluation of the aptamer's affinity to CD19 protein.
FITC-labeled aptamers of various concentrations were incubated with beads coated with the CD19 protein, which were analyzed by flow cytometry. The Kd was estimated by plotting the reciprocal of fluorescence intensity against the reciprocal of DNA concentration.

