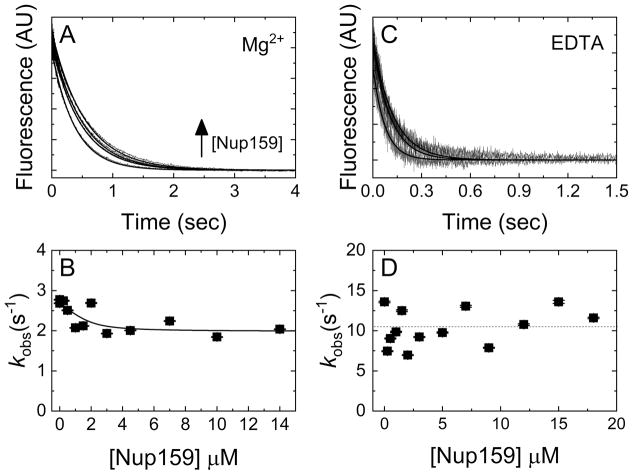
Figure 4. Nup159 minimally affects mantADP(±Mg2+) dissociation kinetics.
(A) Time courses of irreversible Mg2+mantADP dissociation from a pre-incubated solution of Dbp5 (2 μM) and Mg2+mantADP (20 μM) upon mixing with 3 mM Mg2+ADP and (from lower to upper) 0, 1.5, 4.5, or 10 μM Nup159 in assay buffer containing excess MgCl2. Concentrations are final after mixing. Smooth lines through the data represent best fits to single exponentials. (B) [Nup159]-dependence of the observed rate constants obtained from A. The line through the data represents the best fit to Equation 4, yielding KN(+Mg)HmD of 0.3 ± 0.8 μM, k−mD(+Mg) = 2.7 ± 0.1 s−1 and k−mD(+Mg),N = 2.0 ± 0.2 s−1. (C) Time courses of FRET signal change after mixing pre-equilibrated solutions of 1 μM Dbp5 and 40 μM mantADP with an equal volume of (lower to upper) 0, 3 or 9 μM Nup159 and 10 mM ADP in assay buffer containing excess EDTA (ca. 27 nM [Mg2+]free after mixing). The concentrations are final after mixing. Continuous lines through the data represent best fits to a single exponential. (D) [Nup159]-dependence of the mantADP dissociation observed rate constants obtained from exponential fits in C. ANOVA analysis suggests that the dependence is insignificant and the average dissociation rate constant is ~ 11 s−1 indicated by a horizontal dashed line. Uncertainty bars represent standard error of the fits and are contained within the data points.

