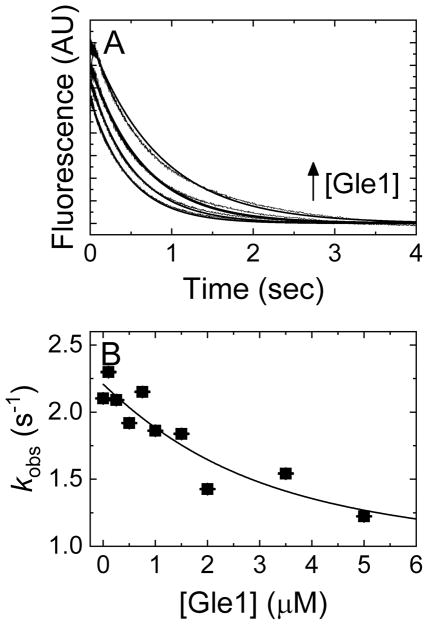
Figure 6. Nup159 has no significant effect on Gle1-mediated Mg2+-mantADP dissociation.
(A) Time courses of FRET signal change upon mixing Dbp5 (2 μM) pre-incubated with Mg2+mantADP (30 μM), Nup159 (2.5 μM) and InsP6 (15 μM) with excess unlabeled Mg2+ADP (3 mM) and (lower to upper curves) 0, 1, 3.5, or 5 μM Gle1 in assay buffer with excess MgCl2. The concentrations are final after mixing. Smooth lines through the data represent best fits to single exponential. (B) [Gle1]-dependence of the observed rate constant of Mg2+mantADP dissociation from the exponential fit in Panel A. Continuous lines through the data represent the best fit of the observed rate constant to Equation 4, giving a KG(+Mg),HNmD of 1.8 ± 3.2 μM, k−mD(+Mg),N = 2.2 ± 0.1 s−1 and k−mD(+Mg),GN = 0.8 ± 0.9 s−1. Error bars represent standard error of the fits and are contained within the data points

